
Introduction
Benchmark: What a Returned Order Really Costs
Two public anchors frame the scale first: NRF and Happy Returns retail surveys consistently place overall US return rates around 15 to 17 percent of annual sales, and Statista category data shows online apparel return rates commonly exceeding 20 percent, while cross‑border consumer electronics typically run 8 to 12 percent. The cost layers below are aggregated estimates from Globe Fulfillment platform operations in H2 2026 (over 1,200 merchants, about 3.8 million parcels) — an order‑of‑magnitude reference rather than audited statistics.
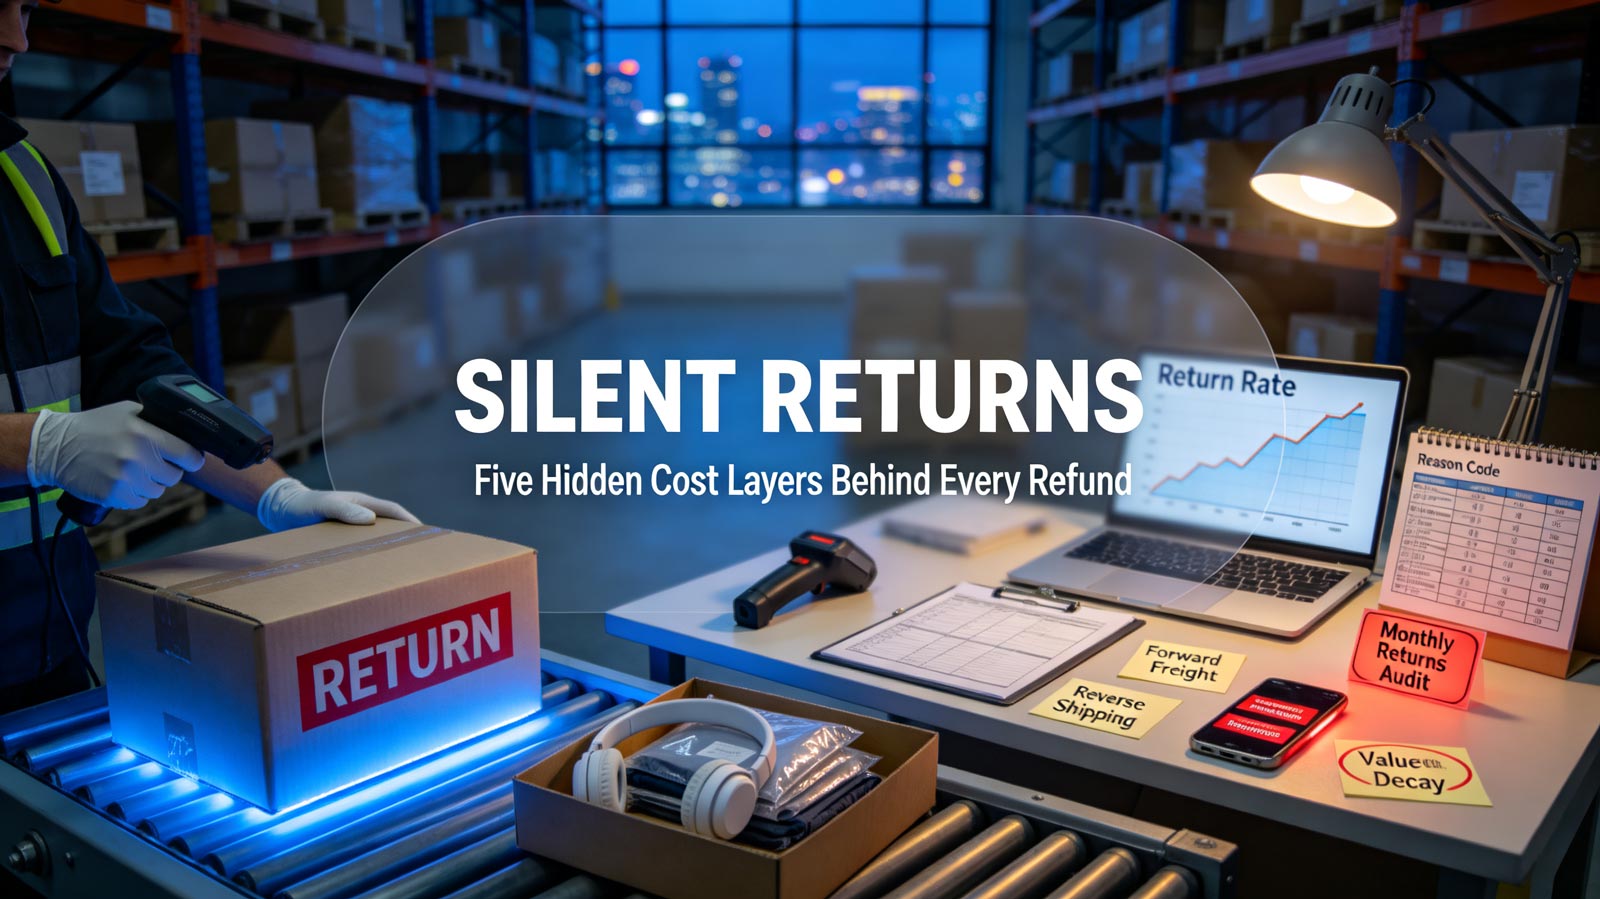
A single returned cross‑border order typically carries five recoverable and unrecoverable cost layers:
- Unrecoverable forward freight: Outbound international shipping and last‑mile delivery are almost never recovered — about $4.20‑$5.80 per parcel on EU and US lanes.
- Reverse logistics: Return labels, consolidated return freight and destination receiving average 35 to 60 percent of the original outbound cost, roughly $3.10‑$3.40 per apparel parcel and $2.80‑$3.40 for small electronics.
- Inspection and refurbishment: Quality checks, repacking, label replacement and cleaning add 8 to 15 minutes of warehouse labor per unit, about $1.20‑$1.80 depending on category handling requirements.
- Resale‑value decay: Returned apparel loses roughly 15 to 25 percent of resale value (sizing‑driven, restockable); opened electronics lose 20 to 40 percent and often cannot re‑enter sellable stock at all.
- Payment and support overhead: Refund processing fees, dispute handling and customer service tickets add a final layer of just under 1% to 1.5%.
From numbers to conclusion: a worked example
The 5 to 8 percent headline is a derivation, not a slogan. Consider two stores, each with one million dollars in annual revenue:
- Apparel‑led store: An average order value of $45 means roughly 22,200 orders. A 20 percent return rate produces about 4,450 returned orders. With a true operational loss of about $13.50 per return — the sum of the five layers above — total annual reverse‑logistics loss reaches about $60,000, or 6 percent of annual revenue.
- Electronics‑led store: An average order value of $55 means roughly 18,200 orders. A 9 percent return rate produces about 1,640 returned orders. At a loss of $11.40 per return — the figure later observed in the case below — total loss reaches about $18,700, or just under 2 percent of annual revenue.
The 5‑8% range therefore describes apparel‑ and high‑return‑category‑led catalogs; blended multi‑category stores typically land between 2 percent and 6 percent depending on category mix. Stores auditing only the refund line miss 60‑70% of the true loss in either scenario.
Five Root‑Cause Clusters Behind High Return Rates
- Expectation mismatch: Product pages overstate size accuracy, material quality or compatibility. This is the dominant driver in apparel (over 70 percent of avoidable returns in platform data) and the top driver in electronics (compatibility confusion for accessories and peripherals).
- Delivery‑related triggers: Late or damaged deliveries convert into "didn't need it anymore" or "arrived broken" returns rather than direct complaints — a failure mode that belongs to the delivery‑promise layer, not product quality.
- Quality variance: Batch‑level defects concentrated in specific suppliers or restock cycles, invisible without return‑reason tagging by SKU and batch. Concentration risk is higher in electronics, where a single defective batch can generate hundreds of same‑reason returns within weeks.
- Impulse and gift returns: Q4 gift‑driven orders carry structurally higher return rates that persist into January, distorting baseline metrics — concentrated in apparel, home and lifestyle categories.
- Policy‑driven returns: Overly generous no‑questions windows train repeat return behavior in a small buyer segment responsible for outsized reverse volume; apparel stores with 60‑day windows see measurably higher repeat‑returner share than those with 30‑day windows.
The Monthly Returns Audit Workflow
- Tag every return with a structured reason code at refund initiation — never rely on free‑text notes alone. Enforce tagging in the refund flow itself; in platform data, stores with optional tagging average only 60‑70% coverage in month one.
- Join return data with fulfillment logs by SKU, supplier batch, warehouse and carrier lane to localize failure points.
- Compute true cost per returned order (all five layers above) rather than refund value only; rank SKUs by absolute annual loss, not rate, and use category‑specific benchmarks (20% and above for apparel, 8‑12% for electronics).
- Set intervention thresholds: SKUs exceeding category benchmarks enter a fix queue — page copy revision, supplier renegotiation, packaging upgrade or delisting.
- Review monthly and reconcile with inventory planning: Returned units re‑entering stock must adjust replenishment forecasts to prevent overselling the same units twice.
Store Observation
A mid‑size EU consumer electronics store held a stable 6.1 percent return rate — seemingly healthy — while margin kept slipping in H1 2026. After running the full cost‑chain audit, the team found opened‑box returns were being liquidated at a 55 percent discount with reverse freight still unpaid, pushing true per‑return loss to $11.40.
The remediation was not smooth. The first attempt applied reinforced corner packaging to the entire catalog, which raised per‑parcel packaging cost by 40 cents and erased nearly half of the projected savings; the fix was narrowed to high‑return batches only. Structured reason‑code tagging also under‑performed initially — coverage reached only 61 percent in month one until code selection was embedded as a mandatory step in the refund flow. With compatibility filters tightened on product pages, batch‑level packaging applied selectively, and inspection‑qualified units returned to sellable stock on a 30‑day delay buffer, the store cut annualized reverse‑logistics losses by 34 percent over two quarters.
Operational Link
Core Takeaways
- A returned order costs far more than its refund: the five cost layers typically consume 5‑8% of annual revenue for apparel‑led catalogs and roughly 2‑3% for electronics‑led stores.
- The 5‑8% figure is derivable per store: multiply your return rate by the true operational loss per return, where that loss spans forward freight, reverse shipping, inspection, value decay and payment overhead.
- Audit true cost per returned order across all five layers, rank SKUs by absolute loss against category‑specific benchmarks (20% and above for apparel, 8‑12% for electronics), and expect tagging adoption — not analysis — to be the first operational bottleneck.
- Returns data should drive product‑page revisions, supplier decisions, packaging standards and replenishment forecasts — not just after‑sales policy.