

Introduction
Benchmark: The Completion Divide Across DTC Stores
Industry data consistently segments cross‑border merchants into three checkout tiers:
- Top‑converting stores: overall checkout completion above 40%; payment‑step abandonment below 25%; mobile completion within 5 points of desktop.
- Mid‑tier stores: 25%–35% completion; abandonment driven by surprise costs, limited payment options, and multi‑step checkout fatigue.
- Struggling stores: below 20% completion; effectively paying ad costs to re‑acquire the same high‑intent visitors, with CAC climbing quarter over quarter.
This divide is rarely about product appeal. Most abandoners have already chosen the item—the leak happens between "add to cart" and "pay." Top‑tier operators audit the final funnel steps with the same discipline they apply to product‑page conversion.
Metric 1: Payment Option–Buyer Mismatch Rate
he most under‑measured leak in cross‑border stores. Abandonment clustered at the payment step—rather than spread across the funnel—almost always signals a method problem, not a price problem.
Diagnostic signals:
- Payment‑step drop‑off spikes in specific markets: German buyers expecting PayPal or invoice options, Southeast Asian buyers expecting e‑wallets, US buyers expecting BNPL on orders above $80.
- Mobile abandonment at payment exceeds desktop by more than 10 points—usually missing express wallets (Apple Pay / Google Pay).
Fix: Localize the payment mix per destination market and add BNPL for AOV above your threshold. Stores that align payment methods with local expectations routinely lift payment‑step completion by double digits—without touching ad spend.
Metric 2: Landed‑Cost Surprise Rate
ndustry surveys consistently show that extra costs revealed at the final step are the #1 stated abandonment reason. For cross‑border stores the surprise is compounded: shipping fees plus duties and taxes appearing only at order review—costs the merchant may never have clarified as prepaid or collect‑on‑delivery.
Diagnostic signals:
- Exit‑page clustering at the order‑review step rather than the cart.
- A/B tests that surface total cost earlier in the funnel lift completion—proof the surprise, not the amount, kills the sale.
- Higher abandonment rates in markets where DDP (Delivered Duty Paid) is uncommon and buyers expect customs friction.
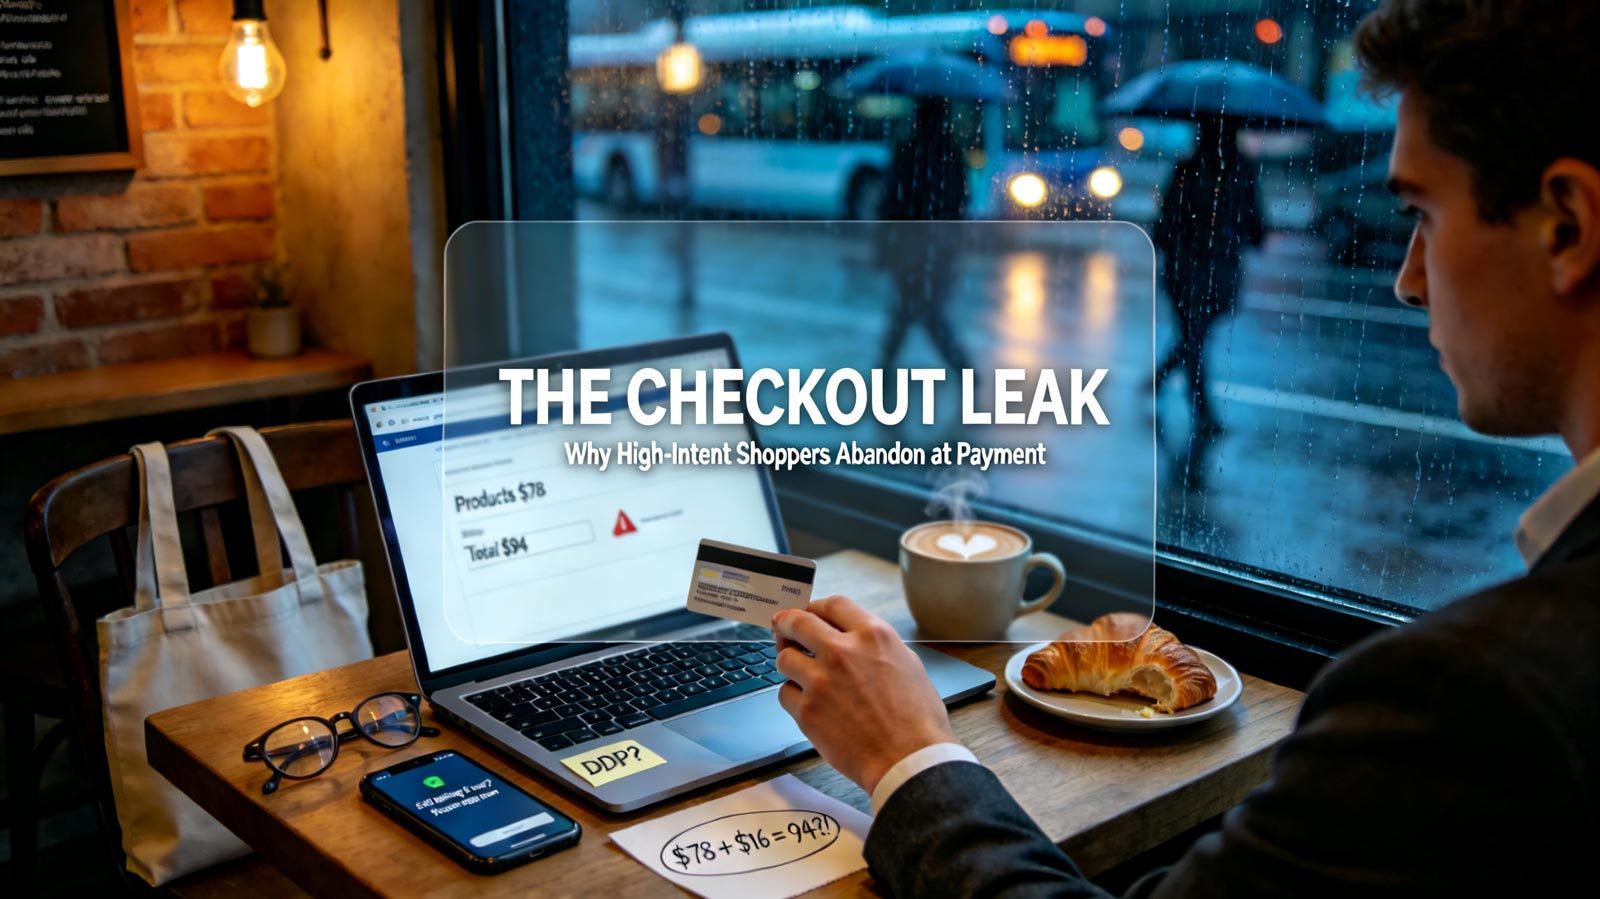
Fix: Show the total landed cost at the product page or cart, not at payment. Where operations allow, shift destination markets to DDP terms so the price the buyer sees is the price they pay—no customs office surprises. A buyer who sees $94 instead of an expected $78 doesn't negotiate; they leave, and a duty collect notice brings them back even less often.
Metric 3: Checkout Friction Index
Every additional step, field, and page load between cart and confirmation costs real conversions; forced account creation alone is a documented top‑3 abandonment trigger.
Diagnostic signals:
- Checkout spans 3+ pages or requires account registration.
- Mobile time‑to‑complete exceeding 2 minutes—keyboard friction and tiny form fields compound.
Fix: Enable guest checkout, compress to a single page or accordion flow, deploy address autocomplete, and default to express wallets on mobile. Each removed step typically pays back within weeks. Friction fixes are necessary—but on their own they don't solve a trust problem.
Metric 4: Abandoned‑Cart Recovery Capture Rate
Even optimized stores lose 60%+ of carts. The differentiator is how much of that loss is recovered. A structured recovery flow should recapture 8%–15% of abandoned cart value; a single "you forgot something" email captures almost none.
Diagnostic signals:
- No recovery flow, or a single untimed email blast.
- Discount‑led recovery training buyers to abandon intentionally and wait for coupons.
- Recovery revenue below 5% of abandoned cart value.
Fix: Run a three‑touch sequence—reminder at 2 hours, objection‑handling content at 12 hours, and a threshold‑based incentive at 24–48 hours only for non‑openers. Use dynamic checkout links that restore the cart in one click, and reserve discounts for the final touch to protect margin.
The Fulfillment Layer: Every Checkout Promise Is a Warehouse Decision
Here is the connection most store audits miss: the three biggest cross‑border hesitations at payment—"When will it arrive?", "Will I pay customs fees?", "What if I need to return it?"—are not marketing questions. They are fulfillment capabilities.
- Delivery dates buyers believe require stock positioned close to the destination market, not a generic "7–15 business days" range padded for ocean freight uncertainty. Stores shipping from overseas warehouses can display exact dates—and checkout data consistently shows specific dates convert better than ranges.
- Duty‑free clarity requires DDP‑capable shipping lanes and customs handling, so the checkout total is the final total.
- Return confidence requires a local or regional return address; a cross‑border return‑to‑origin policy is a silent conversion killer, especially in apparel and home goods.
Stores that treat fulfillment setup as checkout optimization—local stock, DDP terms, local returns—remove the last reasons to hesitate before payment.
Practical Case: From a Leaking Checkout to a Conversion Engine
Take an EU‑market home‑goods store with $120K monthly revenue and a 2.8% conversion rate: 74% cart abandonment, rising CAC. The audit revealed card‑only payments, costs revealed only at payment, a forced‑registration checkout, no recovery flow, and vague delivery ranges driving support tickets.
The store added local payment methods, surfaced landed costs in the cart drawer, switched to one‑page checkout, launched the three‑touch recovery sequence, and moved best sellers into an overseas warehouse—enabling exact delivery dates, DDP terms, and local returns. Within 90 days, completion rose from 26% to 39%, recovery captured 11% of abandoned cart value, and revenue grew 18% with zero added ad spend.
Core Takeaways
- Payment‑step abandonment above ~35% signals a method mismatch or cost surprise—not a traffic problem; fix the final step before buying more top‑of‑funnel clicks.
- Every cost revealed after the cart (shipping, duties, fees) converts high‑intent buyers into permanent bouncers; surface the total landed cost early, and prefer DDP terms where operations allow.
- Checkout friction fixes are table stakes; the deeper leaks are trust gaps—delivery confidence, duty clarity, and return assurance—that no page redesign can solve.
- Every checkout promise is a fulfillment capability: local stock enables exact delivery dates, DDP lanes eliminate customs surprises, and local return addresses close the last hesitation—fulfillment setup is checkout optimization.