

Introduction
The Returns Economics Most Stores Never Model
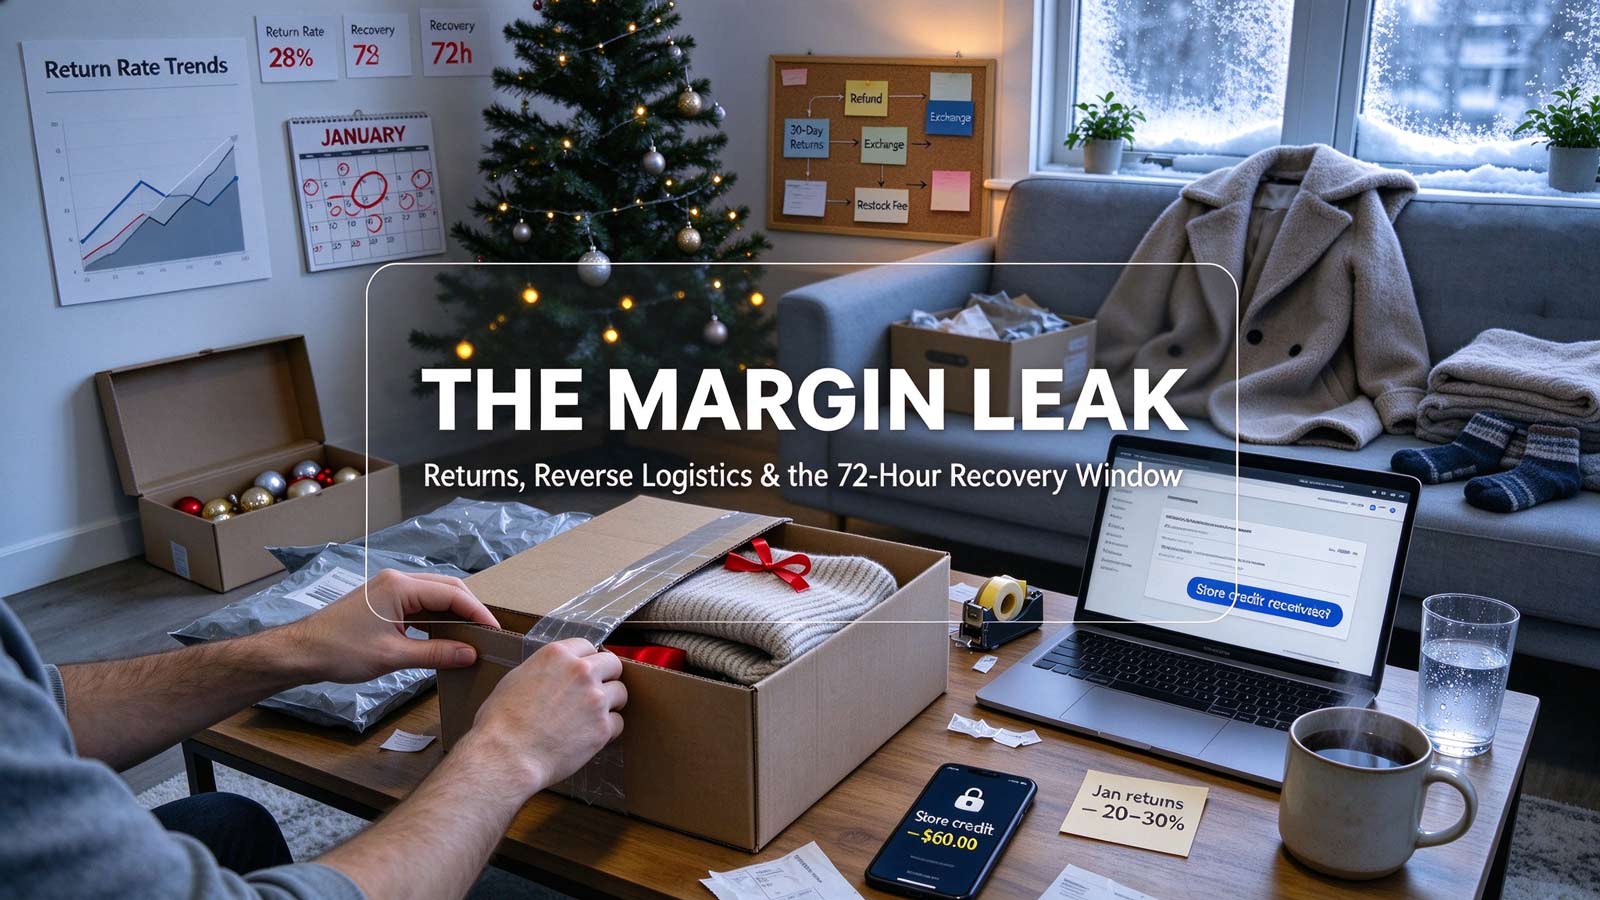
The post‑holiday return wave is not a customer service issue—it is a margin structure issue. Three shifts make it more expensive than most merchants expect:
- Every return touches four cost layers: refund processing, reverse freight, inspection and restocking labor, and resale value decay. Stores that model only the refund systematically underprice their Q4 promotions.
- The arithmetic rarely survives contact: NRF and Happy Returns put the 2025 online return rate at 19.3% of sales, 17% for the holiday window specifically; Coresight Research puts online apparel near 24%, against roughly 10% in‑store. Run a typical $60 apparel order through the reverse chain and refund processing, a return label, inspection and repackaging commonly consume 20–30% of order value before any resale recovery.
- Resale value decays on a clock, not a calendar: across our fulfillment network, goods inspected and relisted within 72 hours recover two to three times the resale value of the same items queued for two weeks. The daily decay math behind that gap is quantified in the infrastructure section below.
- Refund speed now feeds platform ratings: marketplaces and payment providers increasingly weight dispute rates and refund latency, meaning slow reverse logistics bleeds into front‑end conversion months later.
The Four‑Step Reverse Logistics Playbook
erchants containing the leak share a repeatable workflow, run before the January surge:
- Segment Q4 SKUs by structural return risk — size‑dependent apparel, color‑sensitive gifts and "safe choice" items rank highest; commit inventory accordingly rather than uniformly.
- Pre‑position return capacity — negotiate reverse lanes and regional return hubs in November, not January, when capacity is cheapest and carrier slots still exist.
- Set a 72‑hour inspection SLA — define who triages returned goods, what "resalable" means in writing, and which channel receives re‑listed inventory.
- Close the data loop — route return reasons back into sourcing and listing decisions so next season's catalog carries fewer structurally return‑prone SKUs.
How Return Policy Design Quietly Shapes Return Volume
eturn volume is not fixed by customer behavior alone—policy design is the most underused lever a cross‑border merchant controls. Two levers matter most before the January surge.
Default to exchange, not refund. A refund returns the full order value to the customer and zeroes the basket; an exchange keeps it. Returns‑platform and network data consistently show exchange‑first flows retaining over 80% of the original order value that a straight refund would erase. The catch: the exchange flow must be one‑tap simple, or customers abandon it and file disputes anyway.
Layer store credit with a modest uplift. Credit plus a small bonus converts refunds into locked‑in future revenue—and framed as loyalty, customers treat it as a perk rather than a penalty. Keep the bonus modest; large uplifts attract gaming.
The Regulatory Split: One SKU, Three Return‑Cost Structures
A global copy‑paste returns policy quietly over‑complies in some markets and under‑protects in others. Build market‑specific templates instead:
- In the EU, the 14‑day withdrawal right makes the refund a statutory obligation—sellers must refund within 14 days of withdrawal, standard delivery costs included—while return freight can be contractually shifted to the buyer. What changed in 2026 is access: since June 19, Directive (EU) 2023/2673 requires every store selling to EU shoppers to offer a clearly visible, one‑click electronic withdrawal function. Miss that requirement, and the 14‑day clock stretches to 12 months for affected orders. The Q4 2026 compliance to‑do is the button, not the refund math.
- In the UK, the Consumer Contracts Regulations 2013 give online shoppers a 14‑day cooling‑off period plus a further 14 days to send goods back, with refunds due within 14 days of the seller receiving the return. Same clock as the EU, different paperwork, and no withdrawal‑button equivalent.
- In the US, card‑network dispute windows shift risk to chargebacks; fast, visible refunds are cheaper than disputes won late.
The regulatory baseline alone can swing per‑order return cost by double‑digit percentages for the same SKU across these three markets.
The Instant‑Credit Flow: Turning the Return Moment Into Repeat Revenue
Consider two merchants processing the same January return. The first sends a label, waits two weeks for warehouse receipt, then issues a refund—by which time the customer has already bought a replacement elsewhere. The second grants instant store credit at first carrier scan, suggests the correct size, and captures the reorder before the original parcel even arrives back. Same return, opposite economics.
The difference is not technology but sequencing. Credit lands at first scan, the exchange path surfaces while intent is highest, and return reasons are logged as structured data. February campaigns then target customers who exchanged—the proven retention core—while refunders receive win‑back flows instead.
Treat the returns portal as the first touchpoint of the next order, not the last touchpoint of the last one, and Q4's biggest cost line starts returning revenue.
Why Network Infrastructure Decides Recovery Rates
Single‑warehouse merchants force every return into one international lane—slow, expensive, and brutal on resale value. A distributed fulfillment network instead lets returns land at the nearest hub, where local inspection, local relisting and local resale compress the recovery cycle from weeks to days.
The decay behind that gap is measurable: operators typically model 1–2% of resale value lost per day an item sits in the returns queue. On a 14‑day single‑lane cycle, that is 14–28% of recovery value gone before relisting; routing the return to a regional hub cuts the cycle to around three days and preserves double‑digit recovery value at scale. Across a January volume of 1,000 apparel returns, the difference between those two cycles is five figures of recovered margin.
The leak is quiet by design: it never appears as a line item, only as January margin that never materializes. Closing it requires the same infrastructure discipline sellers already apply to outbound—and the merchants who see that first keep the profit Q4 promised.
Core Takeaways
- Post‑holiday returns now decide Q4 profitability: NRF and Happy Returns put the 2025 online return rate at 19.3%, and every return touches refund cost, reverse freight, inspection labor and resale recovery—four cost layers most stores never model.
- Apparel and gift SKUs carry the highest structural return risk—Coresight Research puts online apparel near 24%; segment Q4 inventory by return profile before committing stock.
- Speed is the margin lever: goods relisted within 72 hours recover two to three times more value than items queued for two weeks; at 1–2% decay per day, a 14‑day cycle forfeits 14–28% of recovery before relisting.
- A distributed 3PL network with regional return hubs converts reverse logistics from a silent margin leak into a recovery channel—shortening refund cycles while protecting ratings.