
Introduction
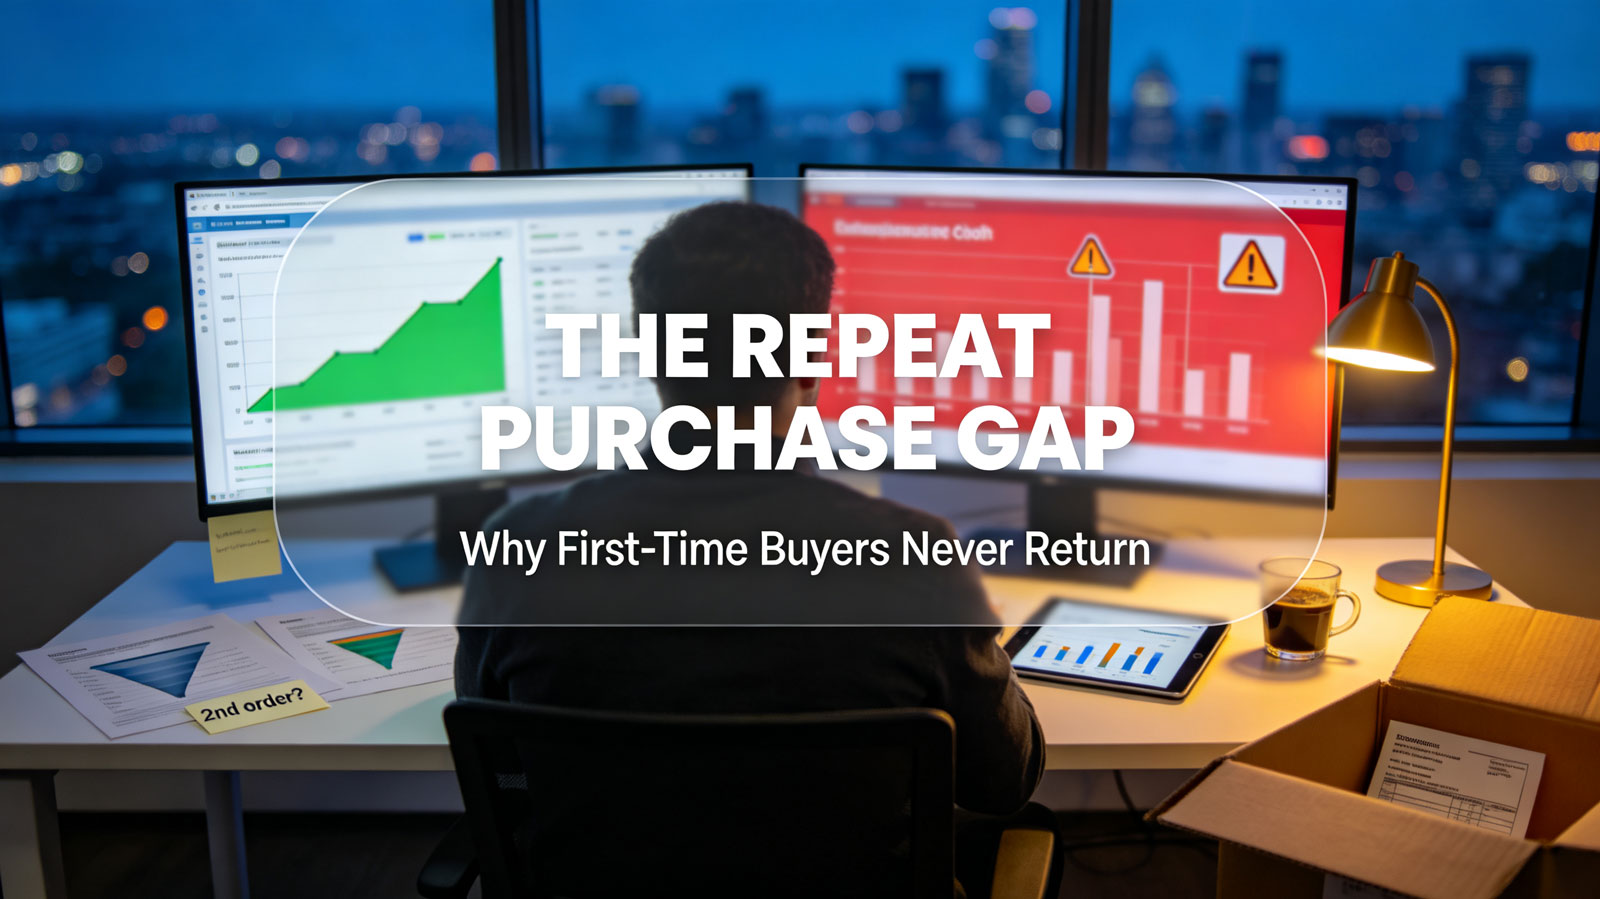
Acquiring a new cross-border buyer costs 5–25× more than retaining an existing one, yet most DTC stores pour the majority of budget into first-time conversion and treat the second order as an afterthought. The result: healthy-looking revenue built on a leaking bucket, where industry studies suggest 60–80% of first-time customers never return. This Store Analysis audit identifies four repeat-purchase metrics that separate retention-driven stores from one-and-done operators—and the operational fixes that close the gap.
Benchmark: The Retention Divide Across DTC Stores
Industry research consistently segments cross-border merchants into three retention tiers:
- Top retention stores: roughly 28%–35% of customers place a second order within 90 days; repeat buyers contribute 45%+ of total revenue.
- Mid-tier stores: a 12%–20% second-order rate within 90 days; revenue still depends heavily on paid first-time acquisition.
- Struggling stores: below 10% second-order rate; effectively re-purchasing every customer through ads, with customer acquisition costs rising quarter over quarter.
This divide is not about traffic quality. Bain & Company famously found that increasing customer retention rates by 5% lifts profits by 25%–95%—yet retention remains unmeasured at most stores. Top-tier operators run repeat purchase as a measured funnel with the same discipline they apply to checkout conversion.
Metric 1: 90-Day Second-Order Rate
The single most predictive retention indicator. Research on buying behavior shows that if a buyer doesn't reorder within 90 days, the probability of a second purchase drops sharply. Stores should calculate this monthly per cohort (first-purchase month, SKU category, traffic source).
Diagnostic signals:
- Second-order rate below 12% usually indicates a broken post-purchase experience (slow delivery, weak unboxing, no follow-up), not a product problem.
- Rate varies sharply by SKU: consumables and replenishment-category products should exceed 30%; durable goods need accessory or refill triggers to convert.
Fix: Trigger a timed post-purchase sequence—delivery confirmation at dispatch, usage guidance at arrival, and a replenishment or cross-sell offer timed to the product's consumption cycle. Stores that align email timing with actual delivery events instead of order dates routinely lift their 90-day second-order rate by double digits.
Metric 2: Time-to-Second-Order Distribution
Aggregate averages hide the truth. Plot the distribution: healthy stores see a second-order peak between day 20 and day 45; struggling stores show a flat line with a small spike only during sitewide promos—meaning repeat purchases are bought, not earned.
Fix: If your curve is flat, introduce "earned" repeat triggers—loyalty points expiring around day 45, bundle-completion offers for complementary SKUs, and win-back coupons deployed at the 60-day silence mark rather than generic monthly blasts.
Metric 3: Repeat Buyer AOV vs. First-Order AOV
In top-tier stores, second orders average noticeably higher than first orders, because returning buyers trust the brand with bundles and premium lines. If your repeat AOV is lower than first-order AOV, your retention is driven by discount-seeking promo chasers—an unsustainable pattern that erodes net margin over time.
Fix: Shift repeat-buyer incentives from percentage discounts to threshold rewards ("free gift over $60") and early access to new SKUs. This protects net margin while still rewarding loyalty.
Metric 4: Post-Purchase Fulfillment Experience Score
Retention is won or lost in the fulfillment window. Consistently observed in DTC operations: stores where delivery lands within the promised window, with accurate picking and intact packaging, see second-order rates roughly 2× higher than stores with equivalent products but inconsistent fulfillment—regardless of price.
Diagnostic signals:
- Repeat rate collapses for cohorts shipped during peak-season carrier delays.
- Buyers whose first order required a support ticket reorder at less than half the rate of trouble-free buyers.
Fix: Audit your first-order experience as rigorously as your checkout: accurate delivery promises displayed at purchase, proactive delay notifications, and a friction-free resolution path for first-order issues.
Practical Case: From One-Time Orders to a Repeat Engine
Consider a typical scenario: a US-market kitchenware Shopify store with $95K monthly revenue had a strong 3.1% conversion rate but flat growth: 82% of revenue came from new customers, and rising CAC erased margin gains. A four-metric retention audit revealed the causes—no post-purchase sequence, a flat second-order curve, repeat AOV 12% below first-order AOV, and 9% of first orders arriving late during carrier disruptions.
The store implemented cohort-timed follow-ups, threshold-based loyalty rewards, delivery-promise accuracy checks, and proactive delay alerts. Within four months, the 90-day second-order rate rose from 9% to 21%, repeat revenue share climbed to 38%, and blended CAC fell 27%—with zero increase in ad spend.
Core Takeaways
- The 90-day second-order rate is the single most predictive retention metric; below 12% signals a broken post-purchase system, not a product problem.
- Healthy stores show a second-order peak between day 20–45; a flat curve means repeat purchases are bought with discounts instead of earned with timing and relevance.
- Repeat AOV should exceed first-order AOV—if it's lower, you're retaining promo chasers and compounding the margin leak.
- First-order fulfillment experience (delivery speed, accuracy, packaging) is the strongest hidden driver of whether a buyer ever returns.