
Introduction
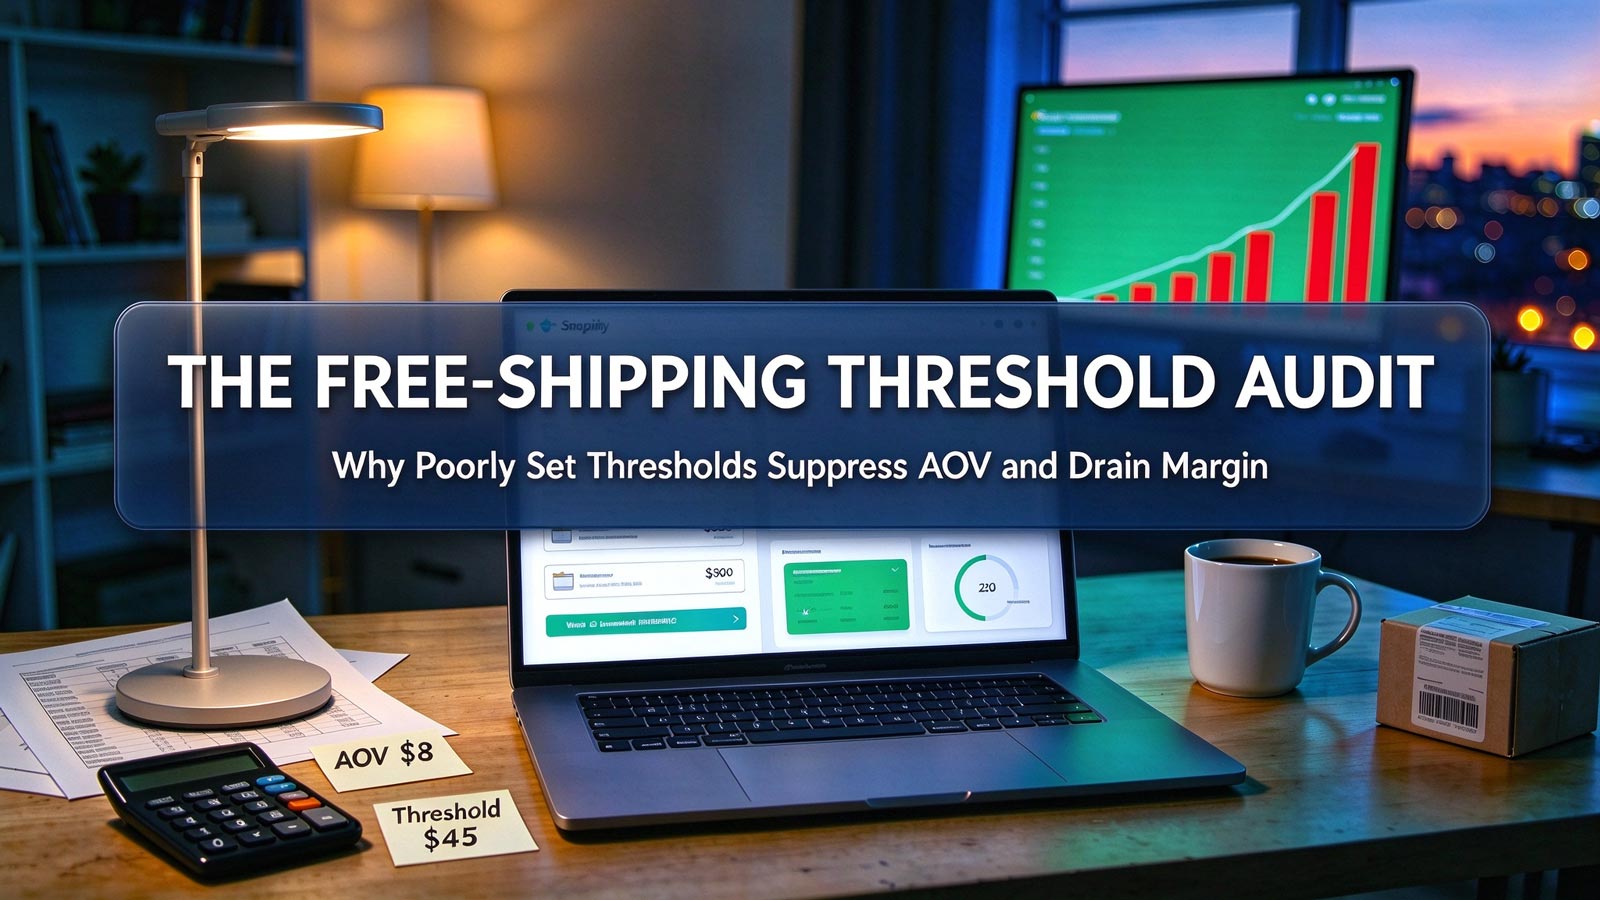
Most DTC operators set a free‑shipping threshold once at launch and never revisit it. That single number quietly shapes cart composition, bundle attachment and margin on every order — yet it rarely appears on any growth dashboard. Based on aggregated H2 2026 fulfillment records, stores running a structured threshold audit lifted AOV by 8% to 14% and recovered 3% to 5% of gross margin, with zero increase in ad spend. This Store Analysis breaks down three failure patterns the audit exposes, benchmarks optimal threshold ratios by store tier, and delivers a repeatable monthly recalibration workflow any store can run in under an hour.
Your Threshold Is a Pricing Decision, Not a Shipping Setting
Most stores treat free shipping as a logistics checkbox. It is actually a price architecture decision sitting at the intersection of customer psychology and unit economics. The threshold performs two jobs at once: it pulls hesitant buyers up to a higher cart value, and it filters out orders whose fulfillment cost would make them unprofitable. A threshold that fails at either job doesn't just leave money on the table — it actively trains customers to buy less, more often, in exactly the pattern that maximizes your per‑order shipping loss.
Three Failure Patterns the Audit Exposes
- Pattern 1: The Invisible Threshold. When the cutoff sits below your median order value, free shipping is the default, not the incentive. Aggregate H2 2026 data shows these stores run AOV 6% to 9% below category benchmarks, with shipping quietly absorbing 4.2% of revenue.
- Pattern 2: The Dead Zone. When the cutoff sits far above typical order value — a $75 threshold on a store whose median order is $38 — abandonment spikes at the shipping reveal step. Review mining flags "shipping cost surprise" and "didn't want to spend that much" among the top complaint clusters in these stores.
- Pattern 3: The Margin Absorber. Thresholds set without SKU‑level weight data invite loss‑leader orders: low‑value carts carrying heavy SKUs that cost more to ship than the margin they earn. These orders pass every dashboard filter while silently eroding net margin each month.
Benchmarks: Where High‑Performing Stores Set the Line
Across aggregated 2026 merchant records, top‑quartile stores share one pattern: the threshold sits at 1.2 to 1.5 times the median pre‑incentive order value.
- Below 1.1 times the median: incentive invisible; AOV flat or declining.
- 1.2 to 1.5 times the median: optimal pull zone; attachment rate peaks here.
- Above 1.8 times the median: dead zone; shipping‑step abandonment rises sharply.
The ratio — not the dollar figure — is the operative metric. It recalibrates automatically as your catalog and customer mix evolve, which is why fixed dollar thresholds drift out of tune so quickly. One nuance from the records: the pull zone works only when the threshold is visible before checkout. Stores that reveal the free‑shipping line at the shipping step capture less than half the AOV uplift of stores displaying it on product and cart pages.
The Monthly Threshold Audit Workflow
Step 1 — Pull the distribution. Export 90 days of order values. Record median, 60th and 75th percentiles, not just the average.
Step 2 — Segment by SKU weight class. Flag carts where projected shipping cost exceeds 12% of order value.
Step 3 — Recompute the ratio. Set the candidate threshold at 1.2 to 1.5 times the median, then sanity-check against weight-class flags.
Step 4 — Instrument the reveal. Track add-to-cart to checkout progression by cart-value band, before and after the change.
Step 5 — Review monthly. The ratio drifts as AOV moves; a cutoff that's optimal in October can be a dead zone by January.
Case Snapshot: One Number, Two Quarters
A home‑goods DTC store ran the audit in July 2026. Its $60 threshold sat at 1.9 times a $31.50 median order — a textbook dead zone. Shipping‑step abandonment ran at 23%, and heavy ceramic SKUs filled 31% of free‑shipping carts, inflating per‑order freight well past margin. The recalibrated threshold of $45 (1.43 times the median) was paired with a bundle prompt triggered on carts above $38. Ninety days later: AOV climbed from $31.50 to $35.90, up 14%; shipping absorbed 3.1 percentage points less revenue; and shipping‑related complaints in reviews fell by a third — with ad spend completely unchanged.
Core Takeaways
- The free‑shipping threshold is a pricing lever, not a shipping setting — one mispriced number suppresses AOV, invites margin‑absorbing orders, and spikes abandonment at checkout.
- Benchmarks from aggregated H2 2026 records put the optimal threshold at 1.2 to 1.5 times the median order value — track the ratio, not the dollar figure.
- Threshold audits are store‑level data work: percentile‑based order distribution plus SKU weight‑class segmentation, reviewed monthly on a fixed cadence.
- Pairing threshold data with a fulfillment partner's real rate card and weight‑tier analytics locks in the gains — you set the number with full visibility into what each order costs to ship.