

Introduction
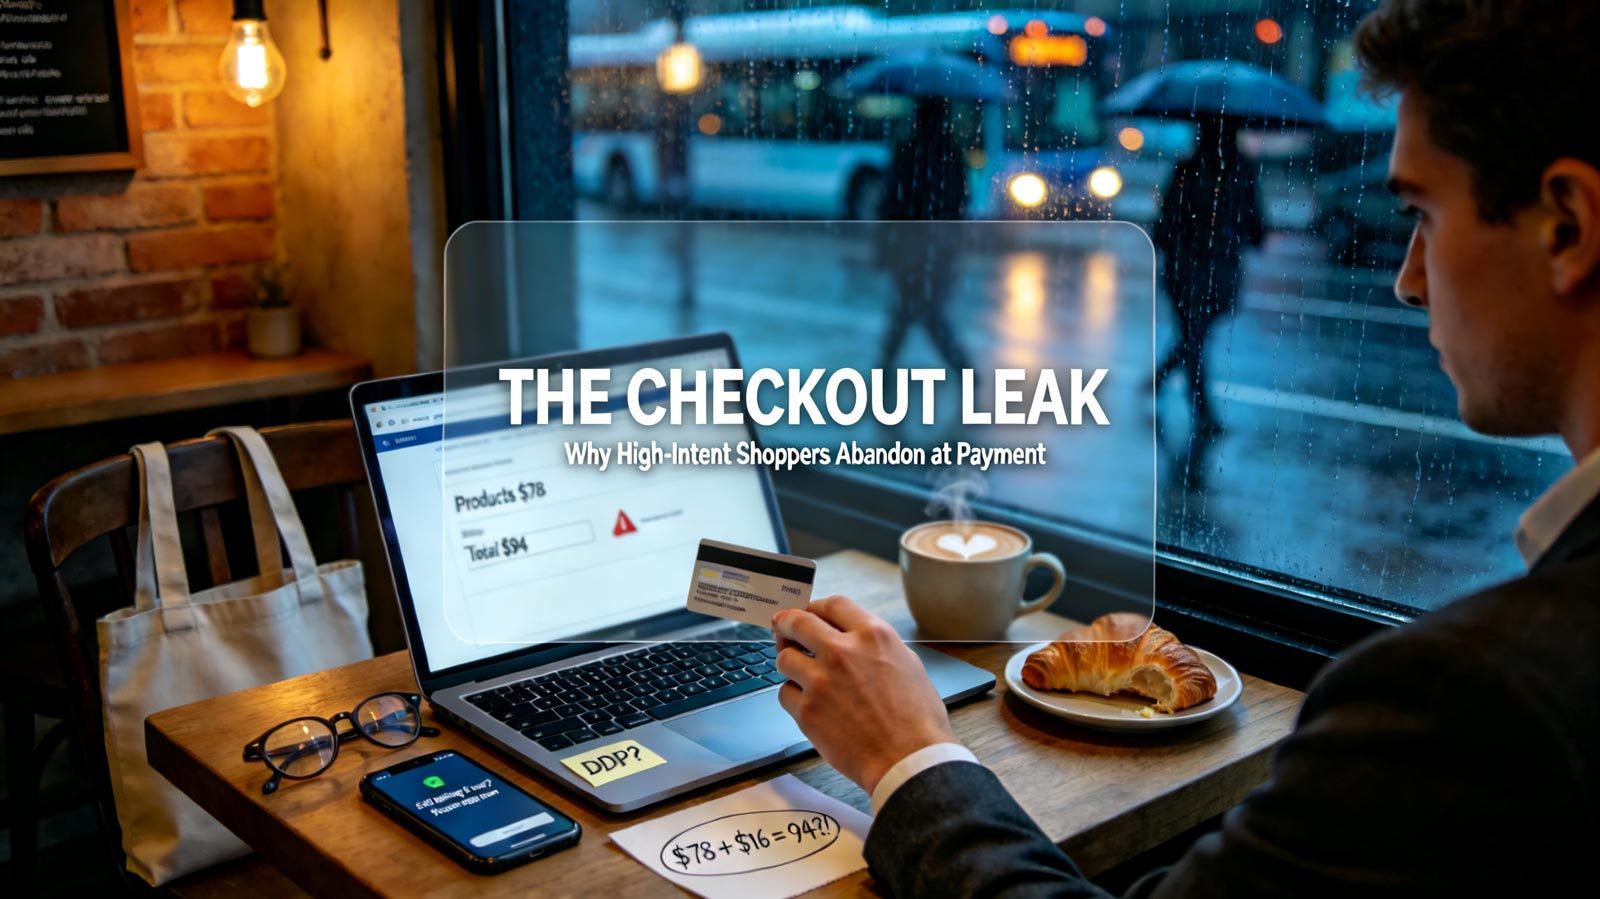
Many cross-border merchants treat strong add-to-cart rates as proof their store is performing. Traffic is stable, product pages convert browsers into cart-adders, yet final order volume stays flat. Industry research shows roughly 70% of online carts are abandoned before payment — and the leaks sit inside the checkout flow, not on the product page. Most sellers respond with deeper discounts or more ads, raising cart volume while the same share leaks at the final step. Here is the 4-metric audit framework.
Benchmark Data: Where the 70% Actually Leaves
Aggregated checkout funnel records from cross-border stores across fashion, home goods, and consumer electronics niches in Q3 2026 confirm that abandonment is concentrated at four predictable leak points:
- Fee-shock abandonment: Sessions where shipping or tax costs appear for the first time at checkout show a 61% immediate exit rate
- Account-forced drop-off: Checkouts requiring account creation lose 28% of buyers at the registration step alone
- Payment coverage gap: Stores missing even one preferred local payment method in their target market lose 12–19% of ready-to-pay buyers
- Delivery clarity exits: Checkouts without a visible, specific delivery date convert 23% lower than those showing a precise window
The pattern is consistent: buyers rarely leave because they changed their minds. They leave because the checkout surprised them, stalled them, or failed to reassure them at the exact moment of payment.
Metric 1: Fee-Shock Rate
What it measures: The percentage of checkout sessions abandoned within 30 seconds of shipping costs, taxes, or mandatory fees being revealed.
Why it matters: Buyers decide affordability at the product page, not the checkout page. When a $4.99 product becomes a $14.70 order, the perceived deal collapses and trust drops with it. This is the single largest leak point in the benchmark data.
How to fix it: Display landed cost estimates on product pages or in the cart preview. If free shipping requires a threshold, show the progress bar before checkout, not inside it.
Metric 2: Step Drop-off Ratio
What it measures: The abandonment rate at each individual checkout step — shipping, payment, review, confirmation.
Why it matters: Aggregate abandonment data hides which specific step kills the sale. Stores often discover that a mandatory phone field, a forced account creation screen, or a slow-loading payment page — not the price — is the true exit trigger.
How to fix it: Enable guest checkout, collapse optional fields, and review step-level analytics monthly. Every field you delete recovers a measurable share of buyers.
Metric 3: Payment Coverage Gap
What it measures: The share of your target market's preferred payment methods your store does not currently support.
Why it matters: A buyer in the Netherlands expects iDEAL. A buyer in Poland expects BLIK or Przelewy24. A German buyer often wants purchase-on-invoice or PayPal as default. Payment preference is a local-trust signal, and its absence reads as "this store isn't for me" at the final click.
How to fix it: Match payment methods to your top three revenue geographies first. Coverage of the top local method matters more than offering ten irrelevant global options.
Metric 4: Delivery Clarity Score
What it measures: Whether checkout displays a specific, credible delivery window — and whether the store's fulfillment operation can actually honor it.
Why it matters: "Ships in 3–5 business days" is a warehouse metric. "Arrives Thursday, Oct 9" is a buyer metric. Vague or overpromised delivery language creates two leaks at once: pre-payment hesitation and post-delivery complaints. This metric connects directly to the fulfillment-alignment standards in our Industry Insights column.
How to fix it: Show a date, not a duration. Buffer your displayed window by one day beyond your 90th-percentile fulfillment time so the promise is always kept.
Diagnostic Checklist
Your checkout flow has structural leaks if any of these are true:
- Add-to-cart rate exceeds 10% but checkout completion stays below 40%
- Shipping costs only appear at the final payment step
- Checkout requires account registration before payment
- Your top revenue market's preferred payment method is unsupported
- Delivery promises use ranges instead of specific dates
- Abandoned-cart emails recover buyers at very low rates despite healthy traffic
Practical Store Case
A European home-storage Shopify store maintained steady traffic and a 14% add-to-cart rate in Q2 2026, yet monthly orders plateaued. The team assumed a pricing problem and tested discounts, which only compressed margin.
After running the 4-metric audit, the leaks were localized: shipping costs surfaced only at the final step, account creation was mandatory, and the store's top market (Germany) lacked invoice-payment and default-PayPal options. The team moved fee disclosure into the cart drawer, enabled guest checkout, and added the two missing German payment methods.
Within 45 days, checkout completion rose from 31% to 48%, and recovered orders from abandoned-cart emails increased 3x — with no change to pricing, ads, or product assortment.
Core Takeaways
- High add-to-cart rates mean nothing if the checkout leaks 70% of ready buyers before payment.
- Fee-shock, forced registration, payment gaps, and vague delivery promises are the four highest-frequency leak points in aggregated merchant data.
- Checkout optimization recovers revenue already paid for by your traffic and ad spend — the cheapest conversion lift available to most stores.
- Fix the leaks before scaling traffic: pouring more buyers into a leaking checkout only wastes the ad budget faster.