
Introduction
Every January, cross-border DTC brands close their holiday revenue dashboards and open a much uglier one: the returns queue. Holiday return volumes run 25–35% above annual averages, and each returned parcel passes through 4–6 touchpoints before final disposition—each one adding cost. Brands that haven't configured returns routing, grading, and restocking workflows before holiday volumes peak will process returns into February, when recovered inventory is worth 30–50% less.
Here is what a returned order actually costs, where margin leaks in the reverse-logistics chain, and a four-stage workflow that determines whether returns erode Q1 margins or partially fund them. Returns infrastructure set up in October will determine how well you handle January volumes—which is why this report publishes in September, not December. All statistics are compiled from aggregated cross-border returns data covering Q4 2025–Q2 2026; actual outcomes vary by niche and resale velocity.
Industry Trend: The True Cost of a Returned Order Is 2–3x What Brands Budget
Most DTC brands budget returns as a single line item: return shipping. Aggregated fulfillment network data suggests reverse shipping typically represents only 30–40% of total returns cost. The remaining 60–70% hides across the chain:
- Inspection and grading. Manual inspection of a returned unit averages 8–12 minutes. During January volume spikes, understaffed warehouses push this to 48–72 hours per batch, delaying every downstream decision.
- Refurbishment and repackaging. 20–30% of returned items require some level of refurbishment before they can be resold. Without standardized grading tiers (A-grade resell, B-grade refurbish, C-grade liquidate), teams default to over-processing or premature write-offs.
- Resale window decay. Apparel resale value drops roughly 10–15% for every two weeks a returned unit sits unprocessed past the holiday peak. Electronics face faster depreciation as new models launch in Q1.
- Refund-timing drag. Customers expect refunds within 3–5 days of return initiation. Brands processing returns slowly often refund before inspection—a goodwill gesture that converts 8–12% of returns into outright losses when items arrive unsellable.
The combined effect: across apparel and home verticals, the fully loaded cost of a processed return—including reverse shipping—averages 25–45% of the item's retail price, before accounting for the margin lost on the original sale. Brands treating returns as a customer-service cost rather than a supply-chain process systematically undercount this exposure by half.
The Four-Stage Workflow That Recovers Margin
Building on the 72-hour returns-processing benchmark referenced in our peak-season deadlines report, this workflow tightens the front end: grade within 24 hours, restock within 48.
1. Routing
Returns cost curves are front-loaded: every unnecessary transit day adds cost without value. Pre-labeled drop-off networks and consolidated weekly inbound freight cut return transit 40–50% and inbound shipping cost 25–35%.
2. Grading
Time-to-grade is the highest-leverage metric in reverse logistics. A three-tier system (resell-ready / refurbish / liquidate) with surge capacity recovers 55–65% of units to resale; untriaged FIFO processing recovers under 40% as unsellable units clog the line while good inventory depreciates.
3. Restocking
A graded unit sitting in quarantine is dead capital. Restocking within 48 hours captures 85–90% of residual value; after 10 days, recovery drops below 60%. Graded returns must sync back to sellable channel stock in near-real-time—fragmented setups routinely leave restocked returns invisible for a week.
4. Re-listing
Recovered units rarely belong back at full price on the main storefront. Deliberate tri-channel routing—A-grade to the primary store, B-grade to outlet/marketplaces at 70–80% of retail, C-grade to liquidation—lifts total recovery value 30–40% and turns returns into a modest secondary revenue stream.
3 Mistakes That Quietly Bleed Returns Margin
1. Refunding before inspecting
Customer-experience pressure pushes brands to release refunds on return initiation. Without fraud screening and condition-based refund tiers, this converts recoverable inventory losses into unrecoverable cash losses at scale.
2. Applying forward-logistics metrics to reverse logistics
Pick rates, on-time rates, and packing accuracy don't capture returns performance. Time-to-grade, recovery rate, and residual-value capture are the metrics that actually describe reverse-logistics health—and most dashboards don't track any of them.
3. Planning returns capacity with annual averages
January returns volume runs 2–3x the monthly average. Brands staffing returns processing to annual mean volume guarantee February backlogs and the value decay that comes with them.
Merchant Action Checklist
- Map total returns cost—including inspection, refurbishment, depreciation, and refund drag—rather than budgeting reverse shipping alone
- Deploy a three-tier grading standard and set a hard target of 24-hour time-to-grade during peak return windows
- Configure pre-labeled routing with consolidated inbound freight to cut return transit time 40%+
- Sync graded returns to sellable channel inventory within 48 hours with condition notes applied
- Build a tri-channel re-listing plan (primary store, outlet/marketplace, liquidation) before January volumes arrive
- Add time-to-grade, recovery rate, and residual-value capture to the Q1 operations dashboard
Core Takeaways
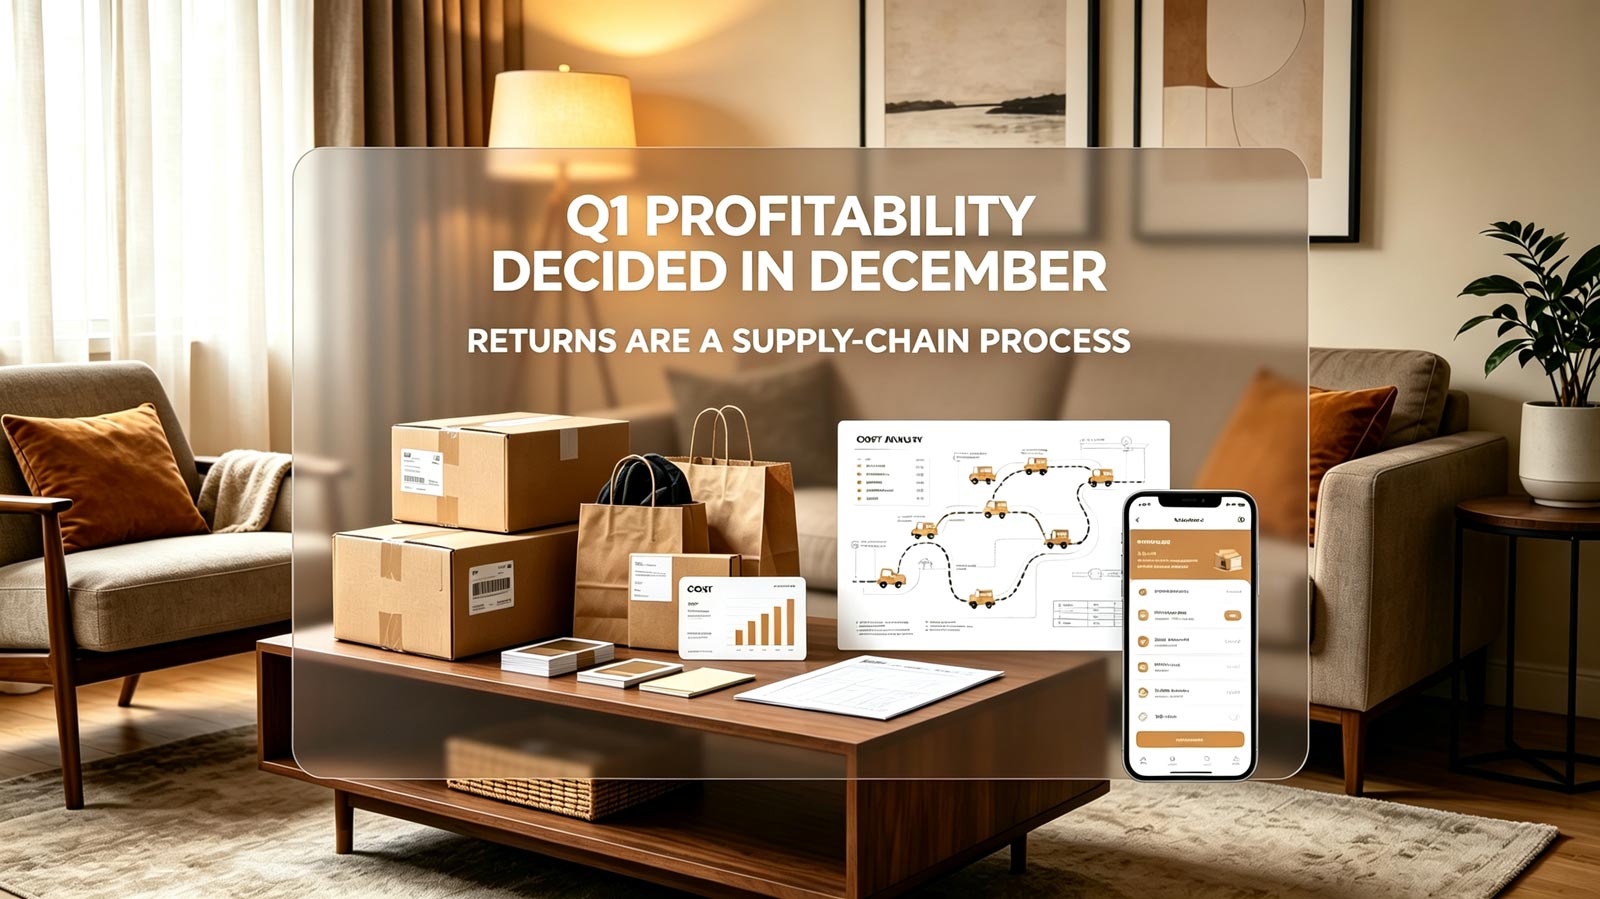
- Holiday returns are not a customer-service problem; they are a supply-chain process with recoverable margin—and Q1 profitability is decided in December, not January.
- The workflow is unforgiving about timing: route fast, grade within 24 hours, restock within 48, re-list to the right channel.
- As outlined in our peak-season deadlines report, returns workflows should be frozen by November 1—this article covers what to freeze. Sellers who configure grading, restocking sync, and tri-channel re-listing before that date enter January with a recovery system; sellers who don't enter it with a backlog.
- Pair this workflow with inventory-efficiency frameworks from our Store Analysis and SKU-screening guidance from Winning Products to close the loop across your product lifecycle.