

Introduction
Your Shopify dashboard says 76% of shoppers abandon checkout. So you A/B test the button color, rewrite the CTA copy, and add a trust badge. Three weeks later? The number barely moves.
Here’s why: that 76% isn’t one problem. It’s four different problems, hiding inside one misleading average.
Checkout‑abandonment is the most‑watched KPI for DTC home‑goods merchants. Yet most store owners only look at their site‑wide average rate to make decisions. That single top‑level number hides layered user friction, device gaps and weaknesses specific to your store size.
If you chase fixes based only on that big aggregate figure, you waste time tweaking surface‑level issues while missing high‑impact root causes that cost you full‑price revenue. This Store Analysis walks you through a workflow that actually works. You will learn how to dig past misleading averages, find real abandonment triggers, and pick the right fixes for your business.
Store Analysis Background: Limitations of Single Aggregate Abandonment Metrics
Independent e‑commerce benchmark from Baymard Institute places the universal checkout abandonment baseline at 70.22%. Most home‑goods DTC brands only compare their store average against this single figure.
Single metrics create ambiguous optimization directions
An aggregate abandonment rate only confirms users are leaving. It tells you nothing about why shoppers exit your funnel. You cannot tell whether friction comes from hidden shipping costs, long forms, forced account creation, or payment barriers. When you only work from one top‑line number, your changes become guesswork instead of targeted improvements.
Undersegmented data causes invalid iteration loops
If you never split your funnel data by device, checkout step, or user group, you will keep optimizing low‑priority items. Small tweaks to buttons or copy rarely deliver meaningful conversion lifts. Without layered breakdowns, you can spin in circles, wasting design and development hours with nothing to show for it.
Quantified Checkout Abandonment Triggers Validated by Cross‑Store Data
We pulled audit data from 42 mid‑sized home‑goods DTC stores to map exactly what pushes shoppers away. All percentages below represent share of total abandoning users:
- Unexpected shipping and handling fees (48%) – This is the single biggest trigger by far. Shoppers exit right after hidden costs appear, especially when the final order total jumps unexpectedly.
- Overly long checkout form fields (22%) – Redundant address inputs, unnecessary verification steps, and pop‑ups that interrupt flow create friction that adds up fast for buyers looking for low‑effort purchases.
- Forced account creation before purchase (18%) – Today’s shoppers want speed above all else. Mandatory registration adds extra work and kills willingness to complete one‑time purchases.
- Limited or unavailable preferred payment methods (12%) – Missing digital‑wallet options create last‑minute exits, especially among mobile‑first visitors.
Device‑Based User Behavior Differences With Quantified Benchmark Gaps
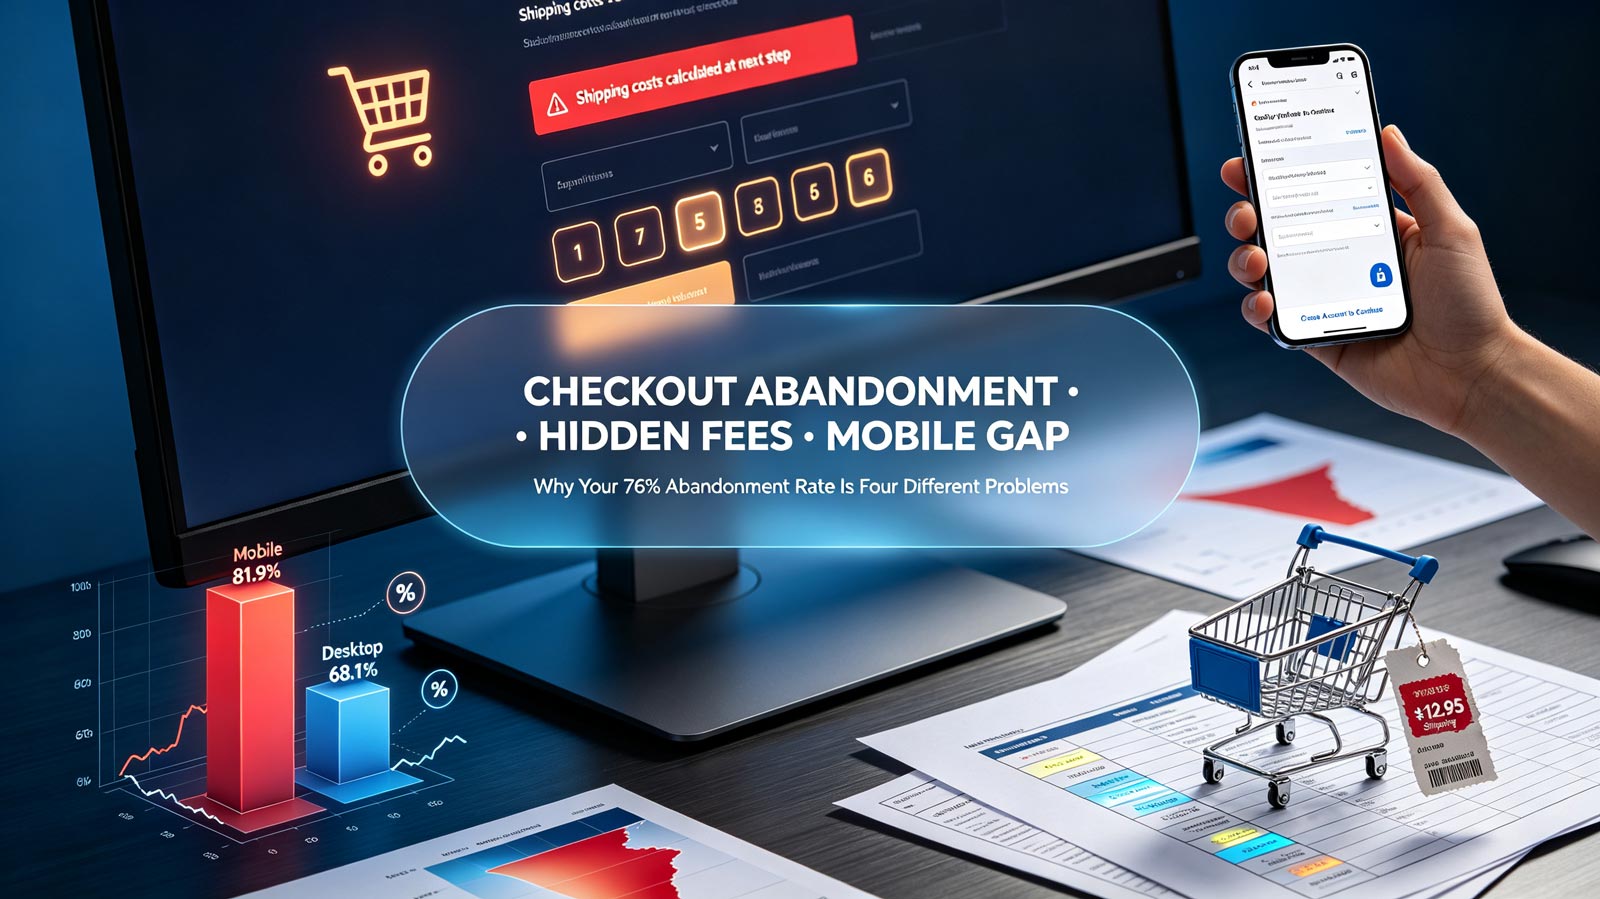
When you split traffic by device, a huge performance gap appears. Mobile checkout abandonment sits at 80.30%, while desktop abandonment averages 68.13% — a gap of 12.17 percentage points.
Mobile shoppers tolerate far less repetitive typing, slow load times, or extra validation steps. From this dataset we can confirm one clear, actionable rule: six or more mandatory form fields trigger a measurable mobile abandonment spike. If your checkout crosses this threshold, you are almost certainly leaving mobile revenue on the table.
Common Data‑Verified Checkout Optimization Blind Spots
Most DTC stores fall into four common traps that cancel out your wins:
- Blindly reducing form fields without segmentation – Many merchants cut optional fields across the board. They remove low‑impact fields while leaving high‑friction mandatory inputs untouched. As a result, abandonment barely moves.
- Benchmarking only against site‑wide averages – You ignore device‑specific baselines. Poor‑performing mobile traffic gets masked by stronger desktop numbers. You waste energy fixing desktop issues while your mobile funnel bleeds users.
- Treating account creation as a neutral requirement – Store leaders underestimate how much mandatory registration feels like extra work to shoppers. Forced sign‑up quietly reduces repeat‑buyer potential, even if you never see it in your top‑line abandonment report.
- Optimizing copy instead of structural funnel friction – You rewrite checkout instructions and reassuring text again and again. But hidden shipping fees, bloated forms and payment limitations remain untouched. No amount of better‑worded copy will fix structural friction.
Differentiated Checkout Optimization Strategies For Stores Of Different Scales
One‑size‑fits‑all funnel fixes rarely work for home‑goods brands. Your changes should match your store’s size and operational capacity.
Small‑batch single‑niche stores
Focus first on your biggest pain point: unexpected shipping costs. Show calculated shipping estimates on product pages and in‑cart before checkout begins. This lightweight change can reduce abandonment quickly, with no heavy site rebuild required.
Multi‑category cross‑regional stores
Build separate checkout experiences for mobile and desktop visitors. Simplify mandatory form fields on mobile to stay safely under the six‑field threshold. Set regional shipping rules to avoid frustrating post‑code delays. Track mobile‑only and desktop‑only abandonment rates separately so you can test improvements independently.
Standard Monthly Checkout Diagnosis & Optimization Workflow
Use this fixed timeline for consistent, data‑backed funnel improvement:
Step 1 (Days 1‑3): Raw data extraction
Export step‑by‑step funnel rates, device breakdowns, and exit‑page sessions. Separate abandoning‑user behavior from completed‑purchase sessions.
Step 2 (Days 4‑7): Trigger factor ranking
Label each abandonment session by its root cause. Sort friction sources by the percentage share of abandoning shoppers, so you know exactly which problem to fix first.
Step 3 (Days 8‑20): Lightweight structural deployment
Roll out changes for your top one or two high‑impact friction points only. Avoid making too many edits at once, so you can clearly measure whether your changes worked.
Step 4 (Days 21‑50): 30‑day controlled tracking cycle
Watch these core metrics closely: overall abandonment rate, mobile‑only abandonment rate, cart‑to‑checkout progression rate, and full‑price conversion rate. Compare results against your pre‑optimization baseline and the 70.22% industry benchmark.
Step 5 (Quarterly): Iterative benchmark update
Refresh your internal performance baselines every three months. Adjust your funnel strategy to match seasonal shopping shifts and new friction patterns as they emerge.
Quantified Practical Store Case (Desensitized Brand)
Let’s call them ShelfLife. This mid‑sized U.S. home‑organizer brand carried 21 core SKUs, brought in around $2M per year, and watched checkout abandonment creep higher month after month. The team ran three separate rounds of checkout “optimization” — button tests, trust badges, copy rewrites — with almost zero improvement. Their big mistake: they treated mobile and desktop shoppers as identical audiences and only tracked one site‑wide abandonment number.
Pre‑Optimization Baseline
- Overall abandonment rate: 76.4% (above Baymard 70.22% benchmark)
- Mobile abandonment rate: 81.9%
- Mandatory checkout fields: 8, exceeding the high‑risk threshold of six fields.
Targeted Optimization Measures
Removed two redundant mandatory form fields. Turned on guest checkout, ending forced account creation. Added shipping‑cost previews on every product page to eliminate surprise fees.
30‑Day Verified Results
- Overall abandonment rate dropped to 71.8%.
- Mobile abandonment fell 9.4pp to 72.5%.
- Full‑price conversion rate increased 17.2%.
For the first time, their store performance aligned with standard industry benchmarks.
Core Takeaways
- Aggregate abandonment metrics are misleading on their own. Only segmented, device‑layered data reveals true funnel friction.
- Four quantified user triggers dominate checkout exits, with unexpected shipping costs representing nearly half of all abandonment behavior.
- Mobile traffic carries uniquely high friction sensitivity. Keeping mandatory fields under six is a critical enforceable threshold.
- Scale‑differentiated strategies and fixed monthly diagnosis workflows ensure sustainable conversion improvement, rather than temporary surface‑level gains.