

Introduction
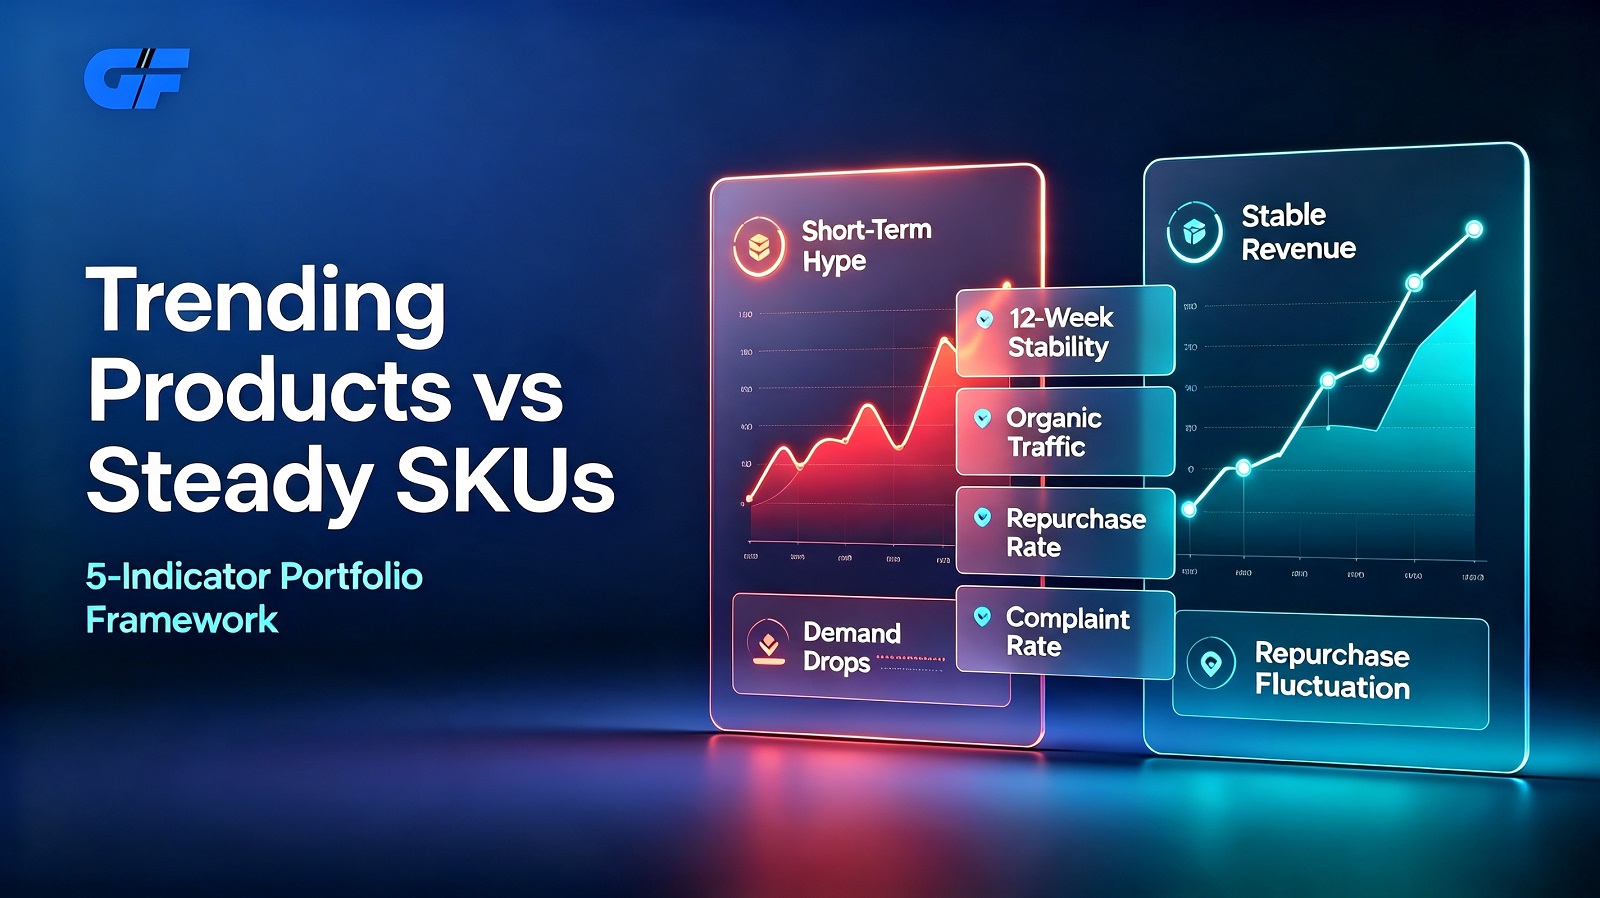
Five Core Data Indicators for Long-Cycle Winning Product Screening
Merchants can extract 90-day historical backend data of all active listings to conduct comprehensive screening. Each indicator reflects one dimension of sustained market recognition, and all threshold references below are summarized from aggregated Q2 2026 store data for risk judgment reference. Every metric below includes clear data source labeling for transparency.
Continuous monthly sales stability
Platform data indicates that order fluctuation ranges are key to measuring steady market demand. Export monthly order volume records of each SKU for three consecutive months. Calculate the month-over-month order swing between each cycle.
Platform data indicates that listings with month-over-month fluctuation controlled within 25% for three consecutive months demonstrate steady market demand signals. Items with month-over-month order swings exceeding 60% usually rely heavily on temporary viral content or seasonal short-term demand, lacking stable natural purchasing intent.
Organic traffic proportion of total visitors
Based on aggregated Q2 2026 store operational records, traffic source breakdown reveals long-term operation viability. Classify listing traffic into paid promotion traffic and organic traffic including search, recommendation and direct access. Count the proportion of organic traffic in overall visitor volume.
Based on aggregated store operational records, viable long-cycle winning products generally carry organic traffic accounting for no less than 40% of total visitors. Listings relying on over 90% paid traffic to generate orders struggle to maintain sales once advertising budgets shrink.
60-day repeat purchase rate
Risk signal thresholds are defined for repurchase performance to flag weak recurring demand. Group order data by customer ID and calculate the share of repeat buyers within 60 days after their first purchase.
Risk signal: Products with a repeat purchase rate lower than 8% rarely develop sustained consumer demand. Merchants stocking large batches of such items face limited recurring order support after initial customer acquisition. Vertical categories with consumable attributes naturally carry higher acceptable benchmark ranges for this indicator.
Uniform customer review sentiment distribution
Platform data confirms negative review share directly impacts long-term organic exposure. Sort verified customer reviews collected over 90 days and tag feedback into neutral, positive and negative categories. Focus statistical tracking on verified negative reviews mentioning product defects or experience mismatches.
Listings where negative experience feedback accounts for more than 18% of total reviews show limited room for long-term sales growth. Persistent negative feedback gradually reduces organic search ranking and platform recommendation exposure over time. Listings maintaining negative feedback below 18% of total reviews pass this indicator.
Long-term inventory turnover cycle
Quick Reference: Screening Thresholds for Eligible Long-Cycle Winning Products
Four Common Unstable Product Traits Observed in Merchant Stores
From quarter-wide product sorting records, four types of listings frequently fail to pass long-cycle winning product screening, each with clear data signals and observable operational impacts.
Products driven entirely by short-term social viral content
Key metric signals: Over 90% of traffic comes from paid social promotion; three-month month-over-month order fluctuation exceeds 60%.
Observable operational impacts: Order volume drops noticeably once platform content trends shift. Pre-purchased inventory cannot clear at original sales speed, creating capital occupation pressure.
Practical adjustment direction: Limit procurement batch sizes for such items, set fixed stock clearance timelines before placing follow-up replenishment orders.
Single-use novelty goods with low repurchase potential
Key metric signals: 60-day repeat purchase rate below 8%; organic traffic proportion under 20%.
Observable operational impacts: Stores keep investing in new customer acquisition while lacking recurring orders to offset advertising expenditure. Gross profit margins are compressed by continuous new listing launch costs.
Practical adjustment direction: Treat these items as limited test lines instead of core winning products, allocate no more than 30% of total product testing budget within the trial item budget pool to this category.
Listings with persistent negative customer feedback
Key metric signals: Negative experience feedback accounts for more than 18% of all reviews; organic traffic volume declines month over month.
Observable operational impacts: Natural search exposure shrinks gradually, requiring rising ad spending to maintain equivalent visitor numbers. Return and after-sales service workload increases steadily.
Practical adjustment direction: Optimize product material descriptions and physical product quality first; pause large-batch replenishment until negative feedback proportion falls below the reference threshold.
Over-niched goods with slow inventory turnover
Step-by-Step Winning Product Screening Workflow
Scale-Based Budget Allocation Benchmarks for Winning Product Portfolios
The recommended capital split below provides adjustable target ranges for merchants, separating core winning product investment and trial item testing funds. These are optimized operational reference ratios, not risk warning thresholds.
Small stores
Monthly revenue below $50K, fewer than 30 active SKUs
Suggested split: 75% inventory capital allocated to screened long-cycle winning products, 25% for short-term trial novelty items. Restrict concurrent test listings to no more than three at any time.
Mid-sized stores
Monthly revenue ranging from $50K to $300K, multi-category layout
Suggested split: 65% inventory capital for verified core winning products, 35% for quarterly small-batch test items. Set independent budget tracking for core lines and trial lines to prevent fund overlap.
Large brand stores