
Introduction
Core Differences Between Trending Goods and Steady-Performing SKUs
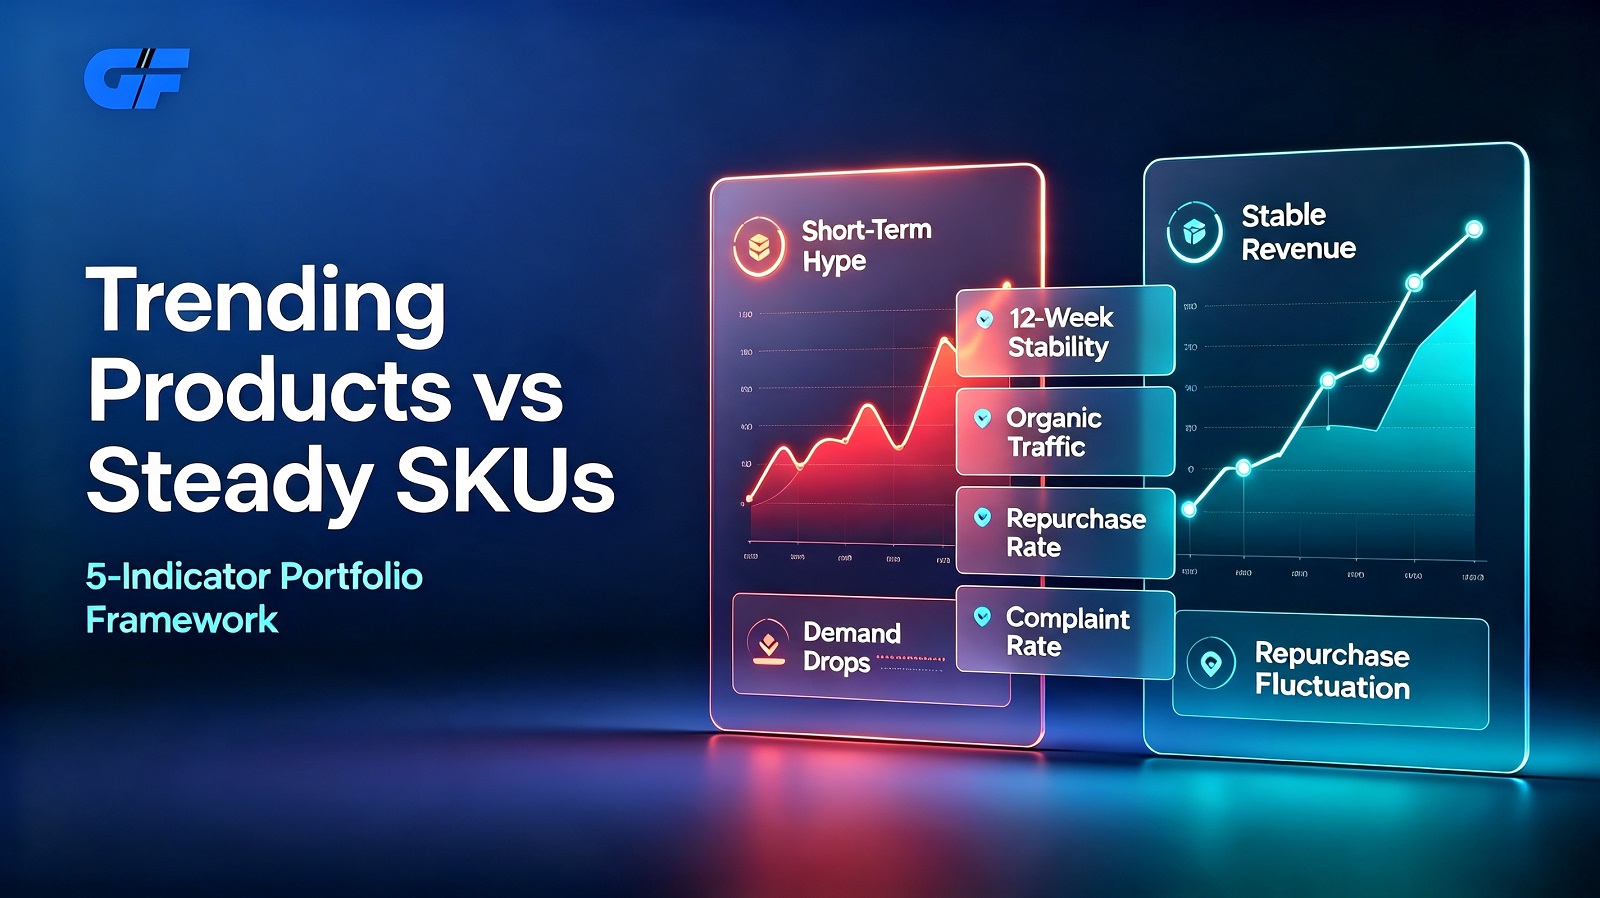
Product performance data and shopper behavior records reveal that trending items and steady SKUs differ significantly across multiple dimensions:
- Shopper interest stems from novelty instead of recurring daily need;
- Sales consistently decline once the trend cools;
- Copycat competitors quickly launch similar listings, creating ongoing price pressure;
- Demand forecasting is challenging, frequently resulting in overstock or stock shortages.
- Supported by year-round organic search traffic, not dependent on temporary social promotion;
- Monthly order fluctuations stay within ±18%;
- Consistent repurchase rates create reliable returning customer revenue;
- Competitive intensity shifts slowly with mild pricing volatility;
- Predictable demand lowers working capital risk and inventory pressure.
Five Quantifiable Indicators to Screen Steady Winning Products
All metrics below are available through standard store backend analytics, requiring no premium third-party tools. Merchants can adjust threshold standards based on individual store scale and niche characteristics.
Evaluate weekly order volume across 12 consecutive weeks. Qualified steady SKUs should not experience any single-week sales drop exceeding 30% of their 12-week average. Internal data shows approximately 27% of SKUs in mature stores meet this stability benchmark.
Products driven primarily by keyword search rather than paid ads or social reels reflect genuine, ongoing user demand. SKUs relying entirely on paid promotion face obvious revenue drop-offs once ad budgets scale down.
For general consumer goods, the cross-border industry average 60-day repurchase rate stands at 7.2%. Reliable steady products typically achieve 10.5% or higher, proving sustained practical value and market recognition.
Products with near-zero complaints often serve overly niche audiences. Stable winning items maintain a complaint rate between 0.8%–2.1%, balancing broad market acceptance and consistent quality performance.
Common Misjudgments When Screening Winning Products
Judging product potential based solely on monthly sales peaks
A single month of high order volume does not guarantee long-term sustainability. Most trending items only achieve one-time peak performance and cannot sustain consistent returns.
Prioritizing one-time sales while ignoring repurchase metrics
Promotional activities can easily inflate one-time transaction volume, while repurchase data accurately reflects real product approval. SKUs without stable repeat purchases cannot form sustainable long-term revenue.
Blindly expanding variants based on one successful SKU
After validating one steady-selling product, some merchants rapidly launch dozens of similar variants. Excess homogeneous listings dilute existing traffic, tie up working capital, and reduce overall store operational efficiency.
Discontinuing data tracking after sales stabilize
Consumer demand and competitor portfolios evolve continuously. Quarterly re-evaluations of the five core indicators are necessary to prevent steady SKUs from gradually turning into low-efficiency inventory.
Tailored Product Portfolio Strategies for Different Store Scales
Small stores with limited cash and inventory
Focus on 8–15 core steady SKUs as the primary revenue source. Cap trending trial items at 3 or fewer, and halt replenishment promptly once sales momentum weakens. Conduct monthly performance reviews to phase out unstable SKUs without delay.
Mid-sized multi-category stores with stable supply chains
Adopt a balanced portfolio structure: 60% stable core SKUs and 40% test trending items. Set independent inventory turnover standards for each category, and allocate 70% of working capital to steady products to secure baseline store revenue.
Large cross-regional brand stores
Build region-adapted steady product lines aligned with local demand traits. Adjust SKU proportions by market, and run quarterly small-scale product trials to supplement new stable alternatives, avoiding over-reliance on aging core listings.
Practical Data Case: US-Focused Home Storage DTC Brand
Store Background
This 2-year-old DTC store operates 76 active SKUs. In Q1 2026, heavy budget allocation toward social trending products led to significant inventory backlogs and unstable monthly revenue performance.
Q2 2026 Optimization Measures
- Analyzed 12-week sales, repurchase, and traffic data across all SKUs to filter 12 high-stability winning products via the five core metrics;
- Optimized capital allocation: 72% of inventory funds reserved for steady core SKUs, 28% for trending trial goods;
- Suspended replenishment for 18 volatile trending SKUs with sharp sales swings;
- Refined product page content for core steady SKUs to boost organic search visibility.
30-Day Verified Improvements
- Monthly store revenue fluctuations narrowed from ±37% to ±14%;
- Overall inventory capital tie-up reduced by 19%;
- Average 60-day repurchase rate of core steady SKUs increased from 8.1% to 11.3%;
- Organic traffic share for core products rose by 22%.
Core Takeaways
- Trending products deliver volatile short-term sales, while steady SKUs sustain long-term revenue stability, contributing 62% of annual income for mature DTC stores.
- Five measurable metrics covering sales stability, organic traffic, repurchase performance, complaint ratio, and seasonal variance effectively identify reliable winning products.
- Stores of different scales can adopt tailored portfolio ratios to balance stable baseline revenue and low-risk new product trials.
- Quarterly SKU performance reviews maintain high-quality product structures and reduce inventory and revenue volatility.