
Introduction
Background of This Platform Upgrade
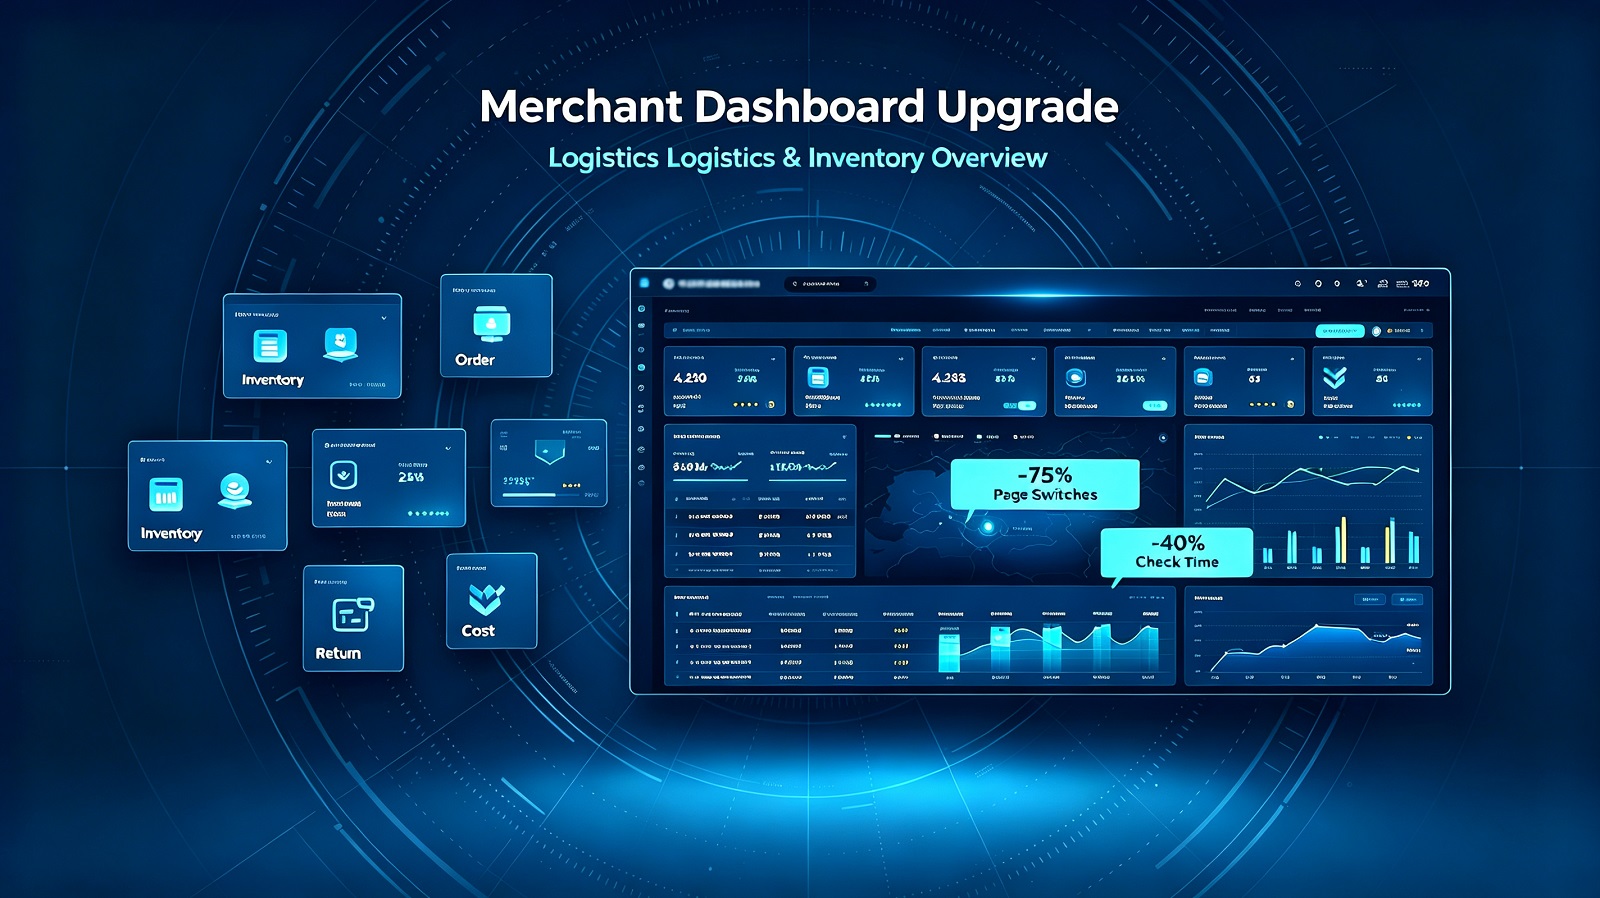
- Merchants need to switch between multiple backend pages to check sales, traffic and inventory data separately, which adds friction to daily workflows;
- Small and medium-sized store teams lack dedicated data staff, making it hard to organize multi-dimensional product performance information efficiently.
Core Functional Updates of the New Data Dashboard
Unified Winning Product Analysis Module
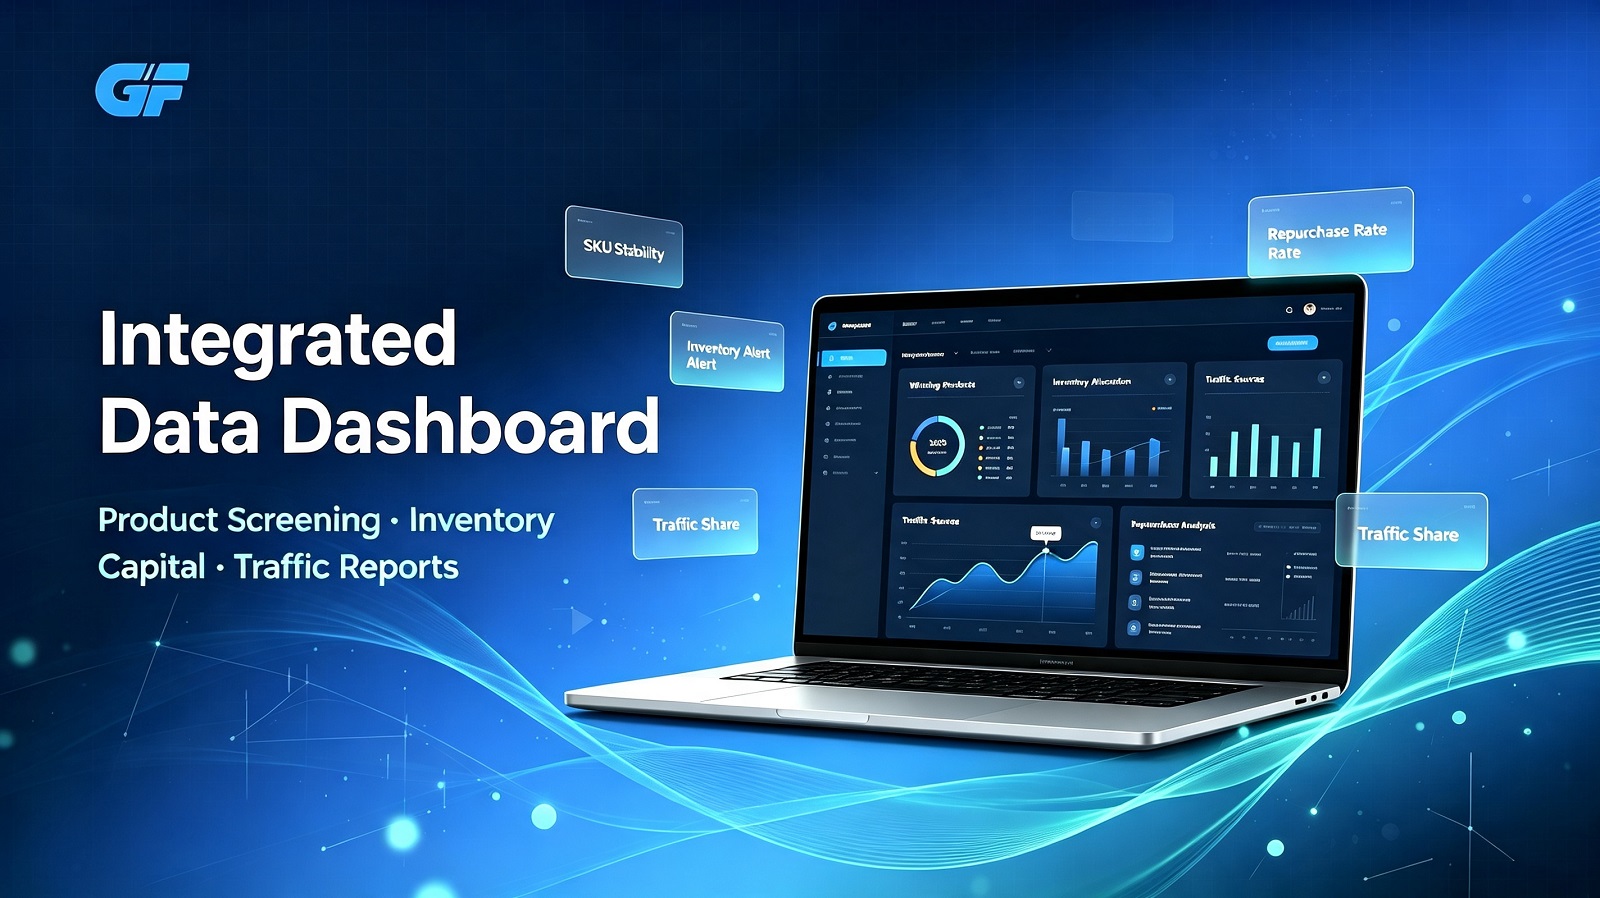
Aligned with our Winning Products column’s data screening standards, the dashboard automatically generates stability ratings for each SKU. It calculates the five core indicators covered in our previous guide: 12-week sales stability, organic traffic share, repurchase rate, complaint ratio and seasonal sales variance. Merchants can quickly filter steady-performing SKUs and high-fluctuation trending items with one click.
The system will not give absolute “best product” recommendations; it only presents objective numerical results for operators to reference based on their own business positioning.
Real-Time Inventory Capital Visualization
The dashboard visualizes working capital tie-up across all SKUs, separating stock allocated to steady core products and trial trending goods. It provides non-intrusive stock alerts when stock levels deviate from merchants’ preset thresholds, helping users arrange replenishment plans in advance and lower the risk of overstock or stockouts.
Simplified Traffic & Repurchase Overview
Organic search traffic, paid ad traffic and social referral traffic are displayed in side-by-side charts. The platform also auto-calculates periodic repurchase rates grouped by product categories, removing the need for merchants to export and organize raw data offline.
Customizable Weekly & Monthly Report Templates
Users can generate downloadable data reports with self-selected metrics. Built-in templates match the quarterly SKU audit checklist shared in our Winning Products content, creating consistent data records for long-term store operation tracking.
Who Can Access the New Dashboard
- All existing standard and premium cooperating merchants can access the dashboard directly via their backend menu without additional application procedures;
- New partners who sign cooperation agreements starting August 2026 will unlock this tool upon account activation;
- Temporary trial users have limited access to basic data viewing functions during their trial period.
Merchant Test Feedback During Internal Beta
- Average time spent on daily data collation dropped by roughly 22%;
- Around 68% of participating merchants stated they could adjust SKU inventory allocation faster with centralized indicators;
- Most small-team operators mentioned reduced reliance on third-party spreadsheet tools for product sorting.
Next Round of Platform Optimization Plans
- A lightweight cost calculation widget for regional shipping and fulfillment expense tracking;
- Expanded data export formats compatible with mainstream spreadsheet software.
How to Start Using the New Dashboard
- Log into your Globe Fulfillment merchant backend;
- Locate the “Data Overview” tab on the left navigation bar;
- Switch to the upgraded integrated dashboard page with one click;
- Visit our help center for step-by-step operation guides if you need clarification on any metric definition.
Core Takeaways
- The unified data dashboard integrates fragmented operational data to cut down merchants’ daily manual data processing work.
- Built-in SKU stability analysis tools connect seamlessly with the product screening frameworks introduced in our Winning Products series.
- The tool is free for all formal partnered merchants, with tiered access limits only applied to temporary trial accounts.
- Continuous iterative optimizations will roll out in Q3 2026 based on real merchant beta feedback.