
Introduction
Store Analysis Background: Limitations of Single Aggregate Cart Abandonment Metrics
Relying solely on overall cart abandonment rates masks hidden checkout experience flaws, creating two persistent operational roadblocks for store teams.
Vague optimization priorities
A high aggregate abandonment rate can stem from disjointed friction points: undisclosed cross-border surcharges, overly lengthy form fields, limited regional payment gateways, or ambiguous delivery timelines. Revising only one checkout module cannot resolve scattered user drop-off triggers.
Wasted iterative development effort
Many operators repeatedly adjust checkout banner copy and pop-up promotions without splitting abandonment data by device type. Mobile and desktop shoppers hold distinct interaction preferences, so one-size-fits-all page layouts fail to address each group’s unique friction sources.
Four Quantified Cart Abandonment Triggers Validated by Cross-Industry Survey Data
All percentage breakdowns below reflect share of total abandoning users across North American and European DTC store samples in Q2 2026:
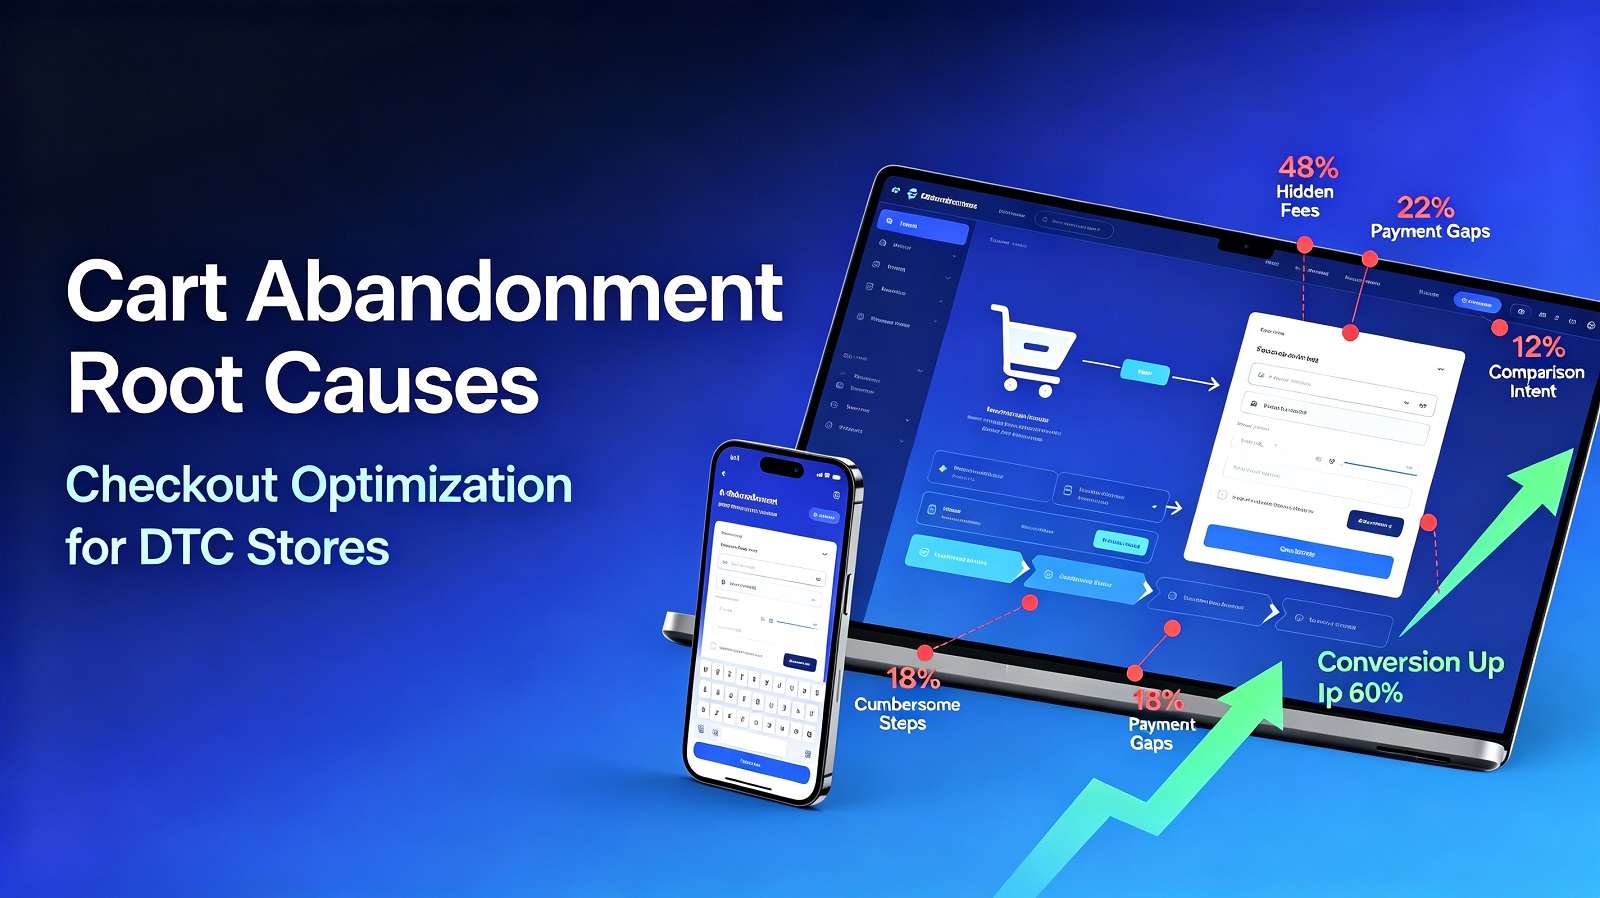
Unanticipated late-stage additional fees
Shoppers add items to carts and exit once shipping, import tax, or customs surcharges appear exclusively on checkout screens. Listings with transparent cost breakdowns featured directly on product detail pages reduce the share of abandonments driven by this trigger by 12 percentage points.
Cumbersome multi-step checkout workflows
Mandatory pre-purchase account registration, redundant multi-field address entry, and fragmented payment selection menus extend settlement time significantly. Mobile visitors show heightened sensitivity to manual data input requirements.
Insufficient local payment method support
When region-preferred payment channels are unavailable during settlement, a portion of users will pause their order rather than switch to unfamiliar payment tools. This friction appears more prevalent within EU market store traffic.
Passive comparison or delayed purchase intent
Some shoppers add goods to carts solely for price benchmarking or future reference, with no immediate settlement plan. This segment represents unavoidable baseline churn that cannot be fully eliminated through checkout page adjustments.
Device-Based User Behavior Differences With Quantified Benchmark Gaps
Mobile Visitors
Mobile traffic generates 60% of total store cart additions and carries an 80.3% abandonment rate, 12.1 percentage points higher than desktop benchmarks. Mobile shoppers exhibit far lower tolerance for pages requiring six or more mandatory input fields, and page load delays over 2 seconds lift mobile abandonment by an additional 9%.
Desktop Visitors
Desktop buyers spend longer reviewing cart totals and comparing auxiliary costs. Their abandonment events correlate most closely with uncompetitive all-in pricing or limited trusted payment options, rather than form length or page speed constraints.
Common Data-Verified Checkout Blind Spots for Independent Stores
Attribute all cart abandonment to uncompetitive product pricing
Many users exit checkout due to operational friction or hidden cost disclosures rather than dissatisfaction with base product pricing. Misdiagnosing churn drivers redirects optimization budget toward price discounts instead of experience fixes.
Modify checkout promotional popups without device-split benchmark data
Over 70% of total abandonment volume concentrates on mobile devices. Adjusting desktop-only page elements will not resolve mobile-specific checkout friction driving most user loss.
Ignore traffic source segmentation when analyzing abandonment data
Shoppers arriving from short-form social content carry far weaker immediate purchase urgency than search keyword visitors. Their abandonment trigger distribution differs materially, and unified checkout layouts cannot match both groups’ intent profiles.
Discontinue cart data analysis after a single audit cycle without recurring reviews
User abandonment trigger distribution shifts alongside seasonal product launches and promotional campaign cycles. Static checkout page layouts gradually fall out of alignment with evolving shopper behavior patterns.
Differentiated Checkout Optimization Strategies For Stores Of Different Scales
Small Single-Category Merchants With Limited Manpower
Small teams should first target the single abandonment trigger with the largest monthly user share. Simplify redundant input fields or add upfront shipping cost disclosures to product detail pages; full end-to-end checkout reconstruction is not required in early optimization phases.
Multi-Category Cross-Regional Brand Stores
Brands serving audiences across multiple geographic markets can build segmented mobile and desktop checkout templates. Match region-specific payment channel combinations and localized tax/shipping disclaimers per market. Conduct quarterly cross-device abandonment data comparisons to rebalance module display priority.
Standard Monthly Cart Abandonment Diagnosis & Optimization Workflow
Quantified Practical Store Case
Case Background
Implemented Optimization Measures
Verified 30-Day Post-Optimization Measurable Improvements